Ecological Committee on FIFRA Risk Assessment Methods (ECOFRAM) Terrestrial Work Group Report: IV. Effects Assessment
On this Page
Introduction
The objective of effects characterization is to evaluate and present measures of effects in a way that they can, in conjunction with exposure characterization, be related to assessment endpoints and ultimately to management goals.
Effects data are generally limited to laboratory tests conducted on designated surrogate species with individuals of a specified age. Oral and dietary exposures which measure acute and subacute responses such as mortality and food consumption, and longer-term tests to assess effects on reproduction are the types of information generally available.
The risk assessor must utilize the available data while considering their limitations. Factors such as whether or not the available data are adequate to extrapolate between species as well as between different life stages within a species; potential indirect and secondary effects and if the data can be extrapolated to populations are examples of risk assessment issues considered by ECOFRAM. The following are examples of ECOFRAM's thinking on these issues.
Adequacy of Current Tests
Acute LD50
LD50 provided in units of dose (mg/kg) which is pertinent to gorge feeding and ingestion of pesticide granules or baits.
Test design is such that estimates of effect other than LD50 value (e.g. LD10) have great uncertainty.
Recommendations for Acute Oral Test
Consider setting more test concentrations near the lethal threshold.
Evaluate the suitability of the Approximate Lethal Dose process to test additional species.
Avian Dietary Test
Provides an estimate of the dietary concentration (ppm) toxic during a five day feeding regime (e.g. LC50).
LC50 is based on concentration in the food rather than as dose ingested (i.e. mg/kg/day)
Food consumption is confounded by undocumented spillage and group housing of birds.
A fixed feeding period (5 days) limits interpretation of the data to this arbitrary exposure period without considering the temporal patterns of effects.
Test concentrations remain constant during the course of the study not reflecting natural degradation processes and thus is primarily useful for chemicals that degrade slowly or are bioaccumulative.
Recommendations for Avian Dietary Test
Design test to determine the daily dosage in mg/kg/day by allowing for a measurement of individual food consumption. This would provide an initial indication of food avoidance.
Experimental design should be flexible to account for temporal pattern of effects and the determination of an incipient LC50.
Avian Reproduction Test
Provides an estimate of statistically significant effects (based on dietary concentrations) on a suite of parental and reproductive parameters.
Effects are based on food concentrations. not on the dose ingested (mg/kg/day).
Food consumption is confounded by undocumented spillage.
Test is not designed to provide a dose-response relationship.
NOEC and NOED is a function of the dietary concentrations selected.
Recommendations for Avian Reproduction Test
Although the test has limitations the Committee concluded that the uncertainties inherent in extrapolation from laboratory tests to field situations are too great to justify major revisions of the current design
Effects Characterization
The characterization of effects results in an effects profile or dose-response profile that provides an estimate of the likelihood (and the uncertainty of the estimate) of a specified effect on a species or taxonomic group at a given likelihood of exposure. The effects profile quantifies the relationship between exposure and the assessment endpoint.
The effects profile should account for the various sources of uncertainty, such as intra- and interspecific variation, known to exist in estimating toxicity to untested species. ECOFRAM considered two similar approaches to quantifying uncertainty based on the number of species tested (Baril, Jobin, Mineau and Collins, 1994, Baril and Mineau, 1996 and Luttik and Aldenberg, 1995). Both of these approaches are based on:
a retrospective analysis of historical data on acute oral tests (LD50) with numerous pesticides and bird species, and
the assumption that the distribution of species sensitivities approximates a log-logistic distribution.
Uncertainty factors were derived that are applied based on the cumulative number of species tested for a given pesticide. For example an uncertainty factor of 10, 5 or 3 may be applied when data are available on 1, 2, or 3 species, respectively. When 4 or more species have been tested the distribution of sensitivity can be calculate directly.
The estimated dose-response relationship for a species of concern conceptually may be derived as follows:
DRRj= DRRtested * IntraF * InterFj * SublF
where,
DRRj = dose-response relationship for species j;
DRR tested = dose-response relationship for one or more tested species (further information below);
IntraF = intraspecific factor is a unitless index reflecting the range of variation among studies, among age groups, etc. (default = 1);
InterFj = interspecific factor is a unitless index to account for variation among species; the index may be specific for species j based on body size (Baril and Mineau 1996) or known relationship to tested species (index = 1 if species j is the tested species);
SublF = sublethal factor is a unitless index to account for observations of sublethal effects in laboratory toxicity tests that may have ecological implications in the field, (default = 1).
Estimate of Magnitude and Probability of Effects
Based on the estimated or measured LD50 or LC50 two dose- response models provides an estimate of the distribution of effects when compared with the dose distribution.
Dose-response approach 1
(based on random tolerances)
This approach emphasizes the concept of a distribution of tolerances. A random tolerance is generated and compared to an exposure. An animal is scored as "killed" if its exposure exceeds its tolerance.
For the probit model, tolerances are assumed to have a lognormal distribution. The logarithms of tolerances are assumed to have mean = Log (LD50) and the standard deviation = 1/slope. This approach can be simplified using the formula:
Random tolerance = LD50 * 10(z/slope)
Where z is a random number from a standard normal distribution (a normal distribution with mean 0 and variance 1.
Dose-response approach 2
This approach emphasizes the dose response function, without reference to a distribution of hypothetical tolerances. Let P(x) denote the probability of response at dose x (possibly random). For the probit model without background mortality, we have
P(x) = · (slope * log( x / LD50 ))
Where · () denotes the CDF of a standard normal distribution. The procedure is to calculate P(x) for the value of x (which may be random), then make a random decision whether the animal is killed (probability = P(x)) or survives (probability = 1 - P(x)). This approach is directly applicable when the dose response function includes background mortality or is not monotone. Otherwise, it is equivalent to Approach 1 however a computer program based on Approach 2 may be more flexible. Both approaches can account for the uncertainty in estimates of the LD50 and the slope by random sampling of their distribution obtainable from standard toxicity studies.
Tables I and II illustrate a tiered approach to deriving an effects profile for the acute oral and acute dietary tests. A similar but more restricted approach may be taken with the reproduction test.ECOFRAM believes that the levels of refinement provided above provides a natural progression which aims to reduce or at least quantify uncertainty. The progression from one level to the next is not intended to be rigid but rather provide the opportunity to move to a higher level of refinement at any point in the risk assessment process.
| Levels of Refinement | ||||
|---|---|---|---|---|
| I | II | II | IV | |
Test species: Focal species:  |
Dose-response (mortality)
|
Dose-response (mortality)
|
Dose-response (mortality)
|
Field assessment of acute mortality rates of marked populations of birds (focal or surrogate species) |
| Input |
|
|
|
Field-collected data on focal or surrogate species |
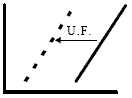
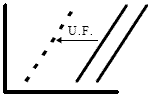
| Interspecific variability | Appropriate uncertainty factor (U.F) | Appropriate uncertainty factor (U.F.) | Distribution of species sensitivities | Focal species monitored directly |
| Intraspecific variability | Accounts for :
|
Accounts for :
|
Accounts for :
|
Variability within studied population is measured |
| Output | Dose response for focal species which ensures that the LD50 is no greater than the 5th percentile of the expected distribution of all species LD50s | Dose response for focal species which ensures that the LD50 is no greater than the 5th percentile of the expected distribution of all species LD50s | Distribution of species sensitivities | Mortality based on actual field exposures; input into population model |
| Uncertainty not accounted for |
|
|
|
Other regions, crops, uses and species of concern, substantially different from field study |
| Levels of Refinement | ||||
|---|---|---|---|---|
| I | II | II | IV | |
| Test species:
Focal species: |
Concentration-response (mortality)
|
Concentration-response (mortality)

|
Concentration-response (mortality)

|
Field assessment of acute mortality rates of marked populations of birds (focal or surrogate species) |
| Input |
|
|
|
Field-collected data on focal or surrogate species |
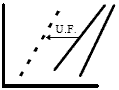
| Interspecific variability | Application of the appropriate uncertainty factor (U.F.) | Application of the appropriate uncertainty factor (U.F.) | Application of the appropriate uncertainty factor (U.F.) | Focal species monitored directly |
| Intraspecific variability | Accounts for :
|
Accounts for :
|
Accounts for :
|
Variability within studied population is measured |
| Modifications to the design of the tests (proposed modifications can be implemented at lower levels) |
|
|
|
|
| Output |
|
|
|
Mortality estimates based on actual field exposures; input into population model |
| Uncertainty not accounted for |
|
|
|
Other regions, crops, uses and species of concern, substantially different from field study |
Outstanding Issues
Indirect Effects
Indirect effects occur when individuals of one species are affected by changes due to direct toxicity to another species that represents food, cover, competition, or a predation threat to the unaffected species. Indirect effects are considerably more complex to understand and to quantify experimentally. As a result the pesticide registration process historically has not addressed indirect affects, and as currently constituted, may be incapable of addressing this issue. ECOFRAM focused on improving the process of direct toxicity with the acknowledgment that indirect effects also need to be addressed in the future.
Sublethal Effects
Current FIFRA mandated toxicity data provide information on mortality and reproductive effects but very little data on adverse effects of sublethal exposure. An observational battery is required for most tests which includes observations on behavior, morbidity et.c. however these effects are difficult to extrapolate to consequences in the field. Some important effects such as suppression of incubation, nest defense and care of young are not addressed under current guidelines. As with indirect effects, ECOFRAM recognizes that sublethal effects must be addressed in more detail in the future.
Citations
Baril, A., B. Jobin. P. Mineau and B.T. Collins. 1994. A consideration of inter-species variability in the use of the median lethal dose (LD50) in avian risk assessment. Technical Report Series No. 216. Canadian Wildlife Service.
Baril, A. and P. Mineau. 1996. A distribution-based approach to improving avian risk assessment. Presented at the 17th Annual Meeting of the Society for Environmental Toxicology and Chemistry, Washington D.C.
Luttik, R. and T. Aldenberg. 1995. Extrapolation factors to be used in case of small samples of pesticide toxicity data: Special focus on LD50 values for birds and Mammals. Environ. Toxicol. 16, 1785-1788.