Progress Report of the Ecological Committee on FIFRA Risk
The ECOFRAM Aquatic Exposure and Aquatic Effects Subgroups
On this Page
- Abstract
- Introduction
- EFFECTS Workgroup Draft Process
- Assessment Methods: IV Aquatic Risk Assessment
- EXPOSURE Workgroup Draft Process
- Issues for Joint Discussion
- List of Issues and Questions from ECOFRAM Exposure Team
Abstract
The Ecological Committee on FIFRA Risk Assessment Methods (ECOFRAM) was formed in June 1997. The Committee's purpose is to develop tools and processes within the FIFRA framework for predicting the magnitude and probabilities of adverse effects to non-target aquatic and terrestrial species resulting from the introduction of pesticides into their environment. An Aquatic Work Group was formed to identify and discuss probabilistic methods for aquatic risk assessments and develop recommendations for future use by EPA. In addition, we are identifying information that must be developed in order to validate the proposed methods in order to ensure that the proposed assessment process, if adopted by EPA, supports environmental decisions that are scientifically defensible.
In accompanying posters, the ECOFRAM Aquatic Exposure and Effects Subgroups are displaying reports on what has been achieved so far. Both groups have progressed to identifying some of the tools which will be needed to perform probabilisitic aquatic effects and exposure characterizations. In addition, both groups have started to consider a "tiered" framework within which the tools should be used along with the criteria that might determine when to move from one tier to the next.
Both teams recognize that one of the fundamental steps to success for ECOFRAM will be the way in which the Aquatic Exposure and Effects subgroups manage to combine their recommendations into an integral Aquatic Risk Assessment approach. The first joint meeting to integrate the two groups views on this will take place in December 1997. The resulting Aquatic Risk Assessment decision tree is expected to be the primary tool for making regulatory aquatic exposure assessments more predictable.
This poster shows the draft decision trees from both groups. The views of attendees will be sought on how the views could be combined. In addition, the poster displays lists of the issues raised so far as well as some key questions to prompt participation from SETAC attendees. The items being presented are "works in progress" and the teams are both requesting feedback from conference attendees especially via participation in the poster session.
Introduction
There are three primary issues facing the ECOFRAM Aquatic team in producing integrated tools for Aquatic Risk Assessment. The primary one is
WHAT IS THE PROCESS THAT WILL BE FOLLOWED AS A RISK ASSESSMENT PROCEEDS FROM THE SIMPLEST LEVEL TO THE MOST COMPLEX??
Traditionally, this has been conceived as a "tier system"; however, it is possible that the process will become a "decision matrix" since it may not be a matter of simple progression from one level of complexity to a higher one. Another idea is for the process to consist of guidance on the criteria for selecting "tools" from the "Aquatic Risk Assessment Toolbox".
There is a need to avoid the use of "bright lines" in the process after the initial tier which decides whether there are any regulatory concerns. A mechanism is required to avoid sterile debates over differences in Risk Quotient (or its probabilistic equivalent) that are insignificant relative to the inherent uncertainty. One suggestion was to define broader "classes" of risk on a Red, Amber, Green basis.
During independent discussion in the workgroups, it is clear that the criteria for progression through the process are likely to be based on interim assessments of risk rather than independent estimates of effects or exposure - i.e. the process will require the efforts of the eco-toxicologist and the exposure scientist to be synchronized. This realization prompts two other key questions:
WHAT METRICS OF EXPOSURE ARE MOST APPROPRIATE FOR COMPARISON WITH EFFECTS??
HOW CAN EXPOSURE PROBABILITY DISTRIBUTIONS AND EFFECTS PROBABILITY DISTRIBUTIONS BE COMBINED INTO A RISK PROBABILITY DISTRIBUTION??
These points may require different answers depending upon where the current risk assessment falls within the overall process.
EFFECTS Workgroup Draft Process
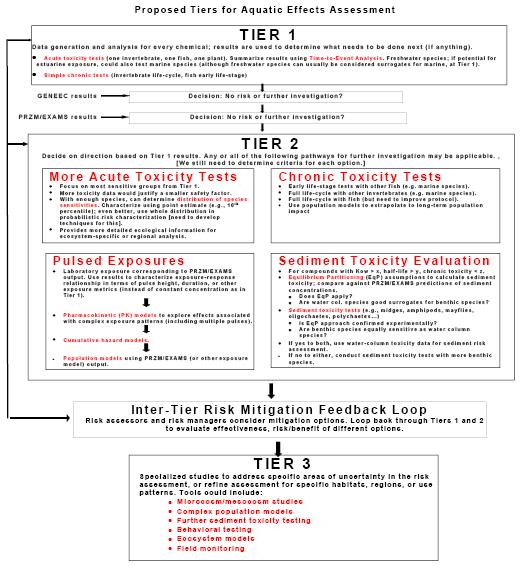
Proposed Tiers for Aquatic Effects Assessment
TIER 1
Data generation and analysis for every chemical; results are used to determine what needs to be done next (if anything).
Acute toxicity tests (one invertebrate, one fish, one plant). Summarize results using Time-to-Event Analysis. Freshwater species; if potential for estuarine exposure, could also test marine species (although freshwater species can usually be considered surrogates for marine, at Tier 1).
Simple chronic tests (invertebrate life-cycle, fish early life-stage)
TIER 2
Decide on direction based on Tier 1 results. Any or all of the following pathways for further investigation may be applicable.
[We still need to determine criteria for each option.]
More Acute Toxicity Tests
|
Chronic Toxicity Tests
|
Pulsed Exposures
|
Sediment Toxicity Evaluation
|
Inter-Tier Risk Mitigation Feedback Loop
Risk assessors and risk managers consider mitigation options. Loop back through Tiers 1 and 2 to evaluate effectiveness, risk/benefit of different options.
TIER 3
Specialized studies to address specific areas of uncertainty in the risk assessment, or refine assessment for specific habitats, regions, or use
patterns. Tools could include:
- Microcosm/mesocosm studies
- Complex population models
- Further sediment toxicity testing
- Behavioral testing
- Ecosystem models
- Field monitoring
Assessment Methods: IV Aquatic Risk Assessment
AGREED AQUATIC RISK ASSESSMENT PROCESS
Subgroup team members and their affiliations are listed in adjacent posters.
THESE ARE DRAFTS FOR DISCUSSION -
PLEASE GIVE US YOUR (CONSTRUCTIVE!!) COMMENTS
The two schemes below reflect the initial thinking of the ECOFRAM Aquatic Effects and Exposure Subgroups. We will be trying to blend it into a common approach in December.
Please pass all comments to: ![]() Paul Hendley (Paul.Hendley@agna.Zeneca.com) or
Paul Hendley (Paul.Hendley@agna.Zeneca.com) or ![]() Jeff Giddings (jgiddings@compuserve.com)
Jeff Giddings (jgiddings@compuserve.com)
EXPOSURE Workgroup Draft Process
Steps in the Exposure Workgroup Draft Process
| Purpose |
|
|---|---|
| Result | "Pass" or "Do further work" decision |
| Scenarios | Semi-specific to crops and use patterns. E.g. row crops may be grouped but uses like rice, cranberries, forest, turf etc will have independent scenarios. It is likely that as the process develops, more and more crop specific scenarios will be incorporated. |
| Output |
|
| Purpose |
|
|---|---|
| Result | "Pass" or "Do further work" or "Modify label" |
| Scenarios |
|
| Output |
|
| NOTE THIS REQUIRES CURRENTLY UNAVAILABLE TECHNOLOGY; MODULE INTRODUCTION WILL HAVE TO BE PHASED. | |
Steps in the Exposure Workgroup Draft Process
| Purpose |
|
|---|---|
| Result | Pass/Label Modification &/or recommendations for agreement with EPA Risk Managers |
| Scenarios |
|
| Output |
|
| MODELING | MONITORING |
|---|---|
PRO
|
CON
|
CON
|
PRO
|
CONCLUSIONS (STILL UNDER DEBATE)
Monitoring may be thought of as another "model" with definable uncertainties - particularly for Surface Water where sampling timings can be critical to capturing an "event".
The most powerful approach would be a combination using thoroughly planned monitoring data across several years to calibrate validated models in which regulators have confidence. The modeling will provide probabilistic estimates of exposure
Issues for Joint Discussion
Pond Parameters
Need to define pond volume to watershed variation by region
Pond/runoff mixing issues and Refugia.
What is the biological significance of runoff entry areas experiencing higher residues while the remainder of the water body gets relatively low exposure??
PRZM/EXAMS predicts immediate mixing!!
What are we trying to protect?? Which habitats are of key interest
- Flowing/static
- Constructed wetlands
- Drainage canals
- Local "features"
Sediment Concentrations
Do we need step I sediment values and water column concns.?
Exposure Duration Step I
How to average data - arithmetic or geometric??
Study Duration vs. Intervals reported - 56 days or 60 days
Exposure Duration Step I
Meaning of 21 day concs if caused by a 1 day spike??
Impact on chronic study design by compound??
Short generation time organisms - what is value of reporting by "annual return frequencies"??
Value of minimum modeling time step of 1 day??
Expression of Combined Probabilities
Use of risk categories
Linking Exposure Estimates to Existing Monitoring data
"Benchmarking"
Model Development, Validation and Research Needs
List of Issues and Questions from ECOFRAM Exposure Team
Needs
We should define storm rainfall in terms of intensities by month and by region
Union between PRZM and EXAMS needs to be improved - SPEED!!
Modeling of SW concentrations is not being evaluated in the FEMVTF model validation program - a program to increase confidence in Surface water predictions needs to be developed.
Issues
How do we express the probability of a given exposure profile??
How should we select values from a distribution of exposure??
How do we describe the shape of a distribution?
Should the selected period of exceedance be tailored to species
1 year in 10 is 0.25 sturgeon lifetimes but 600 daphnia life times (guesses!!)
What are the water bodies of concern -
WHAT ARE WE TRYING TO PROTECT??
Do the species of concern vary with the water bodies of concern?
How do we keep "correlated data" together within a landscape e.g. soil texture with slope with OM may well be correlated within a landscape?? Is this a scale issue??
Does the relatively minor impact of some mitigation approaches truly matter relative to high uncertainties about exposure??
Spatial scale of evaluations important
How can we use existing data from monitoring to help "Benchmark" data sets
Do changes in Ag Practices require changes in models
How do we explain probabilistic approaches in a way that "works"
graphics
explanations
Selection of matching species with exposure estimates
When monitoring, is it better to measure concentrations more often at one place or less often at more places
It is essential to standardize model input selection
There is wide acceptance for including "weight of evidence" for toxicity issues
Why is there no analogous system for using monitoring data to support exposure arguments??
How can we use real weather and relevant weather sequences to generate more than 36-50 year model runs??
How can we deal with specific exposure scenarios - e.g. Florida Sugar cane
Need to evaluate the suitability of the distribution functions we currently use - can geo-statistical approaches help us??
We need to develop models that can examine the impact of buffers and mitigation measures
Need to determine key sensitive variables and then focus on the distribution of THESE variables
Physical models of environmental fate and effects (e.g. Microcosms and fateo- cosms) are important to better define model parameters