Progress Report of the Ecological Committee on FIFRA Risk Assessment Methods: III Aquatic Exposure Assessment
Paul Hendley1, James Baker2, Lawrence Burns3, David Farrar4, Alan Hosmer5, David Jones6,Walton Low7, Mark Russell8, Mari Stavanja9, Martin Williams10 and James Wolf 11
On this Page
- Abstract
- Introduction
- Conceptual Model of Aquatic Exposure
- GENEEC Status and Plans
- More / Improved Data Needed to Support Exposure Modeling
- Affiliations
Abstract
The Ecological Committee on FIFRA Risk Assessment Methods (ECOFRAM) was formed in June 1997. The Committee's purpose is to develop tools and processes within the FIFRA framework for predicting the magnitude and probabilities of adverse effects to non-target aquatic and terrestrial species resulting from the introduction of pesticides into their environment. An Aquatic Exposure Subgroup was formed to identify and discuss probabilistic methods for aquatic exposure assessments and develop recommendations for future use by EPA. In addition, we are identifying information that must be developed in order to validate the proposed methods in order to ensure that the proposed assessment process, if adopted by EPA, supports environmental decisions that are scientifically defensible.
This poster describes the conceptual model the Aquatic Exposure Subgroup has developed along with associated tables listing key factors. In addition, initial recommendations on the current Tier I exposure model (GENEEC) and a list of improvements to the background environmental fate FIFRA "subpart N" studies needed to support aquatic exposure estimates are also presented.
The subgroup recognizes that one of the fundamental steps to success will be the way in which the Aquatic Exposure and Effects subgroups manage to combine their recommendations into an integral Aquatic Risk Assessment approach. In an accompanying poster, the ECOFRAM Aquatic Exposure and Effects Subgroups will present a joint view on how an aquatic risk assessment framework may be generated within ECOFRAM by coordinating the activities of the two subgroups. Draft decision trees will presented from both groups along with key questions to prompt participation from SETAC attendees; the goal of the Aquatic decision tree is to serve as a primary tool in helping to make regulatory aquatic exposure assessments more predictable.
The items to be presented are "works in progress" and the subgroup is requesting feedback from conference attendees with participation in the poster session to help improve the concepts.
Introduction
The individuals listed above as authors represent an effective blend of knowledge, experience and skills. As the ECOFRAM Aquatic Exposure Subgroup, they have been developing a team effort to address the project's goals. During its original meeting, this subgroup developed some goals:
Developing a conceptual framework for the assessment of potential exposure in aquatic systems. This is to be used as an underlying "base-map" against which the desired tools can be scoped out, assessed and qualified.
Develop a tiering system and/or decision tree designed to ensure that the majority of risk managers or assessors would follow a similar path to apply probabilistic techniques to investigate the potential aquatic exposure arising from a particular pesticide use-pattern.
Prescribe the use of "tools" in the tiering system that either exist presently or need to be developed. The group will recommend success criteria and specifications for the probabilistic approaches and tools and processes by which they might be developed.
Develop a list of issues that need to be addressed to help define or characterize the tools and the variability and uncertainty associated with their use..
The group has decided that the factors and issues below should be considered during the process to achieve these goals :
Ecological exposure estimates may also help address concerns raised under the FQPA statute.
Tools to be designed for estimating exposure should, where appropriate, include the ability to help design exposure mitigation options of value for regulatory decision making.
There are many valuable initiatives, workgroups, tools and insights ongoing within the US and international Aquatic Exposure science communities. These should be incorporated/used where appropriate to maximize the efficiency of the ECOFRAM tools.
While a large number of studies currently form part of the FIFRA "subpart N" regulatory requirements for pesticides, the group should consider if these are the most appropriate studies to support the desired aquatic exposure tools and make recommendations where necessary on the organization and content of the existing studies or suggest additional studies where needed.
Conceptual Model of Aquatic Exposure
The draft conceptual model developed by the group to describe the exposure of non-target aquatic systems to pesticides is currently organized as follows:
Overview.
General model of the Aquatic Ecosystem/Agricultural Ecosystem Complex reflecting scale issues
More detailed model of the Agricultural Ecosystem.
List of factors in Agricultural Ecosystems which can influence pesticide fate in soil and subsequent transport via runoff to aquatic bodies
Representation of basic factors influencing potential Spray Drift to aquatic bodies (Based on Spray Drift Task Force(SDTF) effort - no significant ECOFRAM time will be spent on this - therefore no details shown in this poster)
More detailed model of the Aquatic Ecosystem.
List of factors in Aquatic Ecosystems which may influence drift/deposition of pesticides to water bodies, subsequent fate of pesticides and uptake into components of the Aquatic ecosystem at various trophic levels.
More detailed consideration of the influence of the agricultural landscape on the probability of non-target aquatic exposure
List of factors in the Agricultural Landscape likely to affect potential transport of residues to non-target aquatic bodies
The poster covers the highlights of the conceptual model; more detailed draft texts prepared by members of the group have been prepared for some sections and these will be made available at the SETAC conference. Please note that this is a developing framework (especially the graphics!!); other posters will outline the plan for future ECOFRAM communications.
The group is currently trying to rank the most significant factors in each section of the conceptual model and also the variabilities and uncertainties associated with each. In addition, it is thought that the relative time scales of pesticide residue presence in the water bodies compared with relevant biological processes merits further consideration.
The ECOFRAM Aquatic Exposure Subgroup encourages all who attend the poster session to
provide comments. Comments should be addressed to ![]() Paul Hendley [(510) 231 1499 or
Paul.Hendley@agna.zeneca.com] or any of the authors named above.
Paul Hendley [(510) 231 1499 or
Paul.Hendley@agna.zeneca.com] or any of the authors named above.
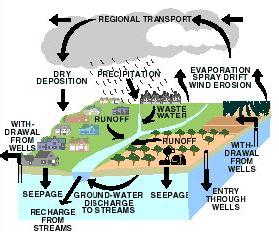
Figure 1
(courtesy of USGS NAWQA)
takes a broad view of potential pesticide transport routes.
Agricultural chemicals are essential for effective food production but may pose potential risks to humans and the environment; EPA OPP has the responsibility to address this dilemma under the FIFRA statute. While it is often assumed that pesticide contamination is an phenomena associated with agricultural areas, recent research shows that urban areas can contribute extensively to pesticide residues in urban streams. Therefore an assessment of the probabilities of non-target aquatic exposure to pesticides must take a wide view of pesticide use.
Figure 1 (courtesy of USGS NAWQA) takes a broad view of potential pesticide transport routes. Once the pesticide has been applied, one of the most significant routes for potential risk to non-target organisms, ecosystems and humans, is via subsequent contamination of the hydrologic system.
Possible atmospheric transport routes are via spray drift, volatilization or wind erosion and subsequent dry fall or deposition in rain
Possible aquatic transport mechanisms are via leaching (seepage) and/or surface runoff.
Movement to natural surface water can be via runoff and/or groundwater discharge
It is likely that the Subgroup will concentrate mostly on refining an understanding of the impact of spray drift and runoff routes of entry on the probabilities of aquatic exposure in non-target water bodies. A major issue that the ECOFRAM process is likely to accentuate is how regulators, the regulated community and society at large can better understand which water bodies need to be protected and to what degree. One corollary to that debate is the recommendation of appropriate modeling scenarios (e.g. edge of field concentrations, concentrations in farm ponds or reservoir residues) for the various "tiers" of an aquatic risk assessment.
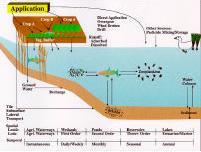
Figure 2
how the agricultural landscape and the aquatic ecosystem interact to influence exposure
Figure 2 shows in more detail how the agricultural landscape and the aquatic ecosystem interact to influence exposure. While most of the themes are developed in detail in later sections of the model, a key point is the range of spatial scales involved for both lentic and lotic aquatic systems and the way this will tend to parallel various durations of exposure. Hand in hand with the increasing duration over which a water body might experience pesticide exposure is the increasing dilution phenomena that come into play. For example, ponds have more depth and overflow potential than wetlands; reservoirs not only have even more depth than ponds, they also tend to collect water from larger areas and so not all the runoff entering the water body will be treated. From a spray drift perspective, as one moves to progressively larger water bodies the chance for even and high level spray drift entry in more than a few margins tend to decrease. Similar trends are seen with lotic systems where flow dilution adds an additional complicating factor.
Table A shows the factors that the subgroup have identified as potentially influencing the fate of the pesticide in the field after application and the subsequent probability of transport to a non-target aquatic system. The work group has been prioritizing the list further regarding which factors may be most significant in order to help focus future efforts on the most worthwhile parameters.
| Chemical Parameter | Soil Parameters | Landscape | Climatic Parameters | Agronomic Parameters | Hydrologic Response | Transport Mechanisms |
|---|---|---|---|---|---|---|
Chemical / Physical
Mobility
Transformation
Formulation Issues??
|
Time-Invariant Factors
Time-Variant Factors
|
Field slope and length Structure of complex slopes Buffers
Wetlands (mitigation) Buffer strips(mitigation) Landscape factor co-occurence |
Precipitation Air temperature Relative humidity Wind speed Solar radiation Antecedent Moisture content Irrigation |
Crop Type Crop Growth Rate Rotational pattern Tillage practices Conservation management practices Application method
Rate Timing |
Infiltration Evapotranspiration Runoff Erosion Tile drainage Macropores |
Canopy washoff Runoff Erosion Volatilization Leaching Tile drainage Runoff Mixing Zone |
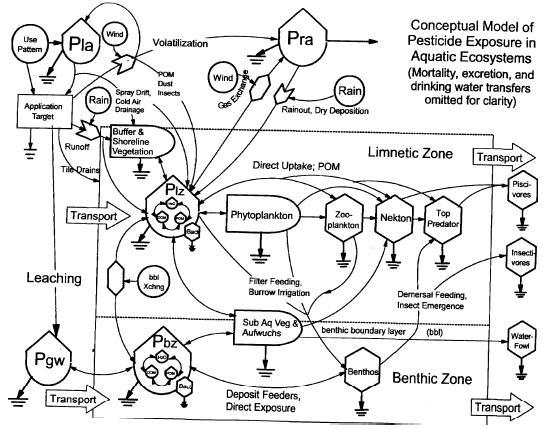
Figure 3
Conceptual Model of Pesticide Exposure in Aquatic Ecosystems
Figure 3 represents the aquatic system using the ecological circuit language designed by H.T. Odum. The arrows to ground represent degradative processes while the tanks represent storage compartments. The model represents direct entry to a static water body (spray drift), runoff entry, interflow entry as well as the potential for buffer area mitigation of runoff entry. In addition, the model covers potential chemical, physicochemical and biological adsorption, transformation, transport and impacts.
Table B provides the supporting list of factors significant for determining the fate of a chemical in the aquatic system. This list is also being prioritized and assessed for contributions to variability and uncertainty.
| Chemical Parameters | Flow / Geometry Parameters | Environmental Parameters |
|---|---|---|
Molecular weight Henry's law constant Solubility Vapor pressure Sediment part. coef. Organic carbon partition coefficient Octanol water partition coefficient Water col bact. rate Benthic bacteria rate Direct photol rate Hydrolysis rate constant |
Horizontal discretization Longitudinal discretization Vertical discretization Bed slope Bed friction Water depth Velocity Dispersion Sediment scour Sediment deposition |
Direct precipitation Pan evaporation Relative humidity Solar radiation Optical path length to vertical depth Mean monthly cloud cover Water temperature Wind shear / atmospheric turb Suspended sediment Plankton population Submerged aquatic plant biomass Benthic bacteria Benthic biomass Fraction of organic carbon Bulk density Sediment porosity Anion exchange capacity Cation exchange capacity Dissolved oxygen Dissolved organic carbon pH pOH |
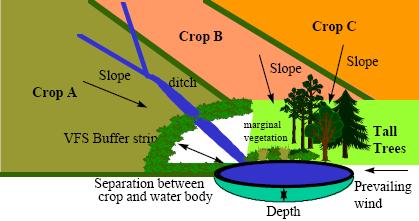
Figure 4
Figurative diagram of an Agricultural Landscape indicating some Factors from Table C
Figure 4 and Table C both reflect factors in the Agricultural Landscape that need to be included in detailed assessments of aquatic exposure arising from pesticide use. For example, the percentage of the crop of interest in the watershed, the proximity of that crop to the water itself, the percentage of the crop that is treated and the spatial relationship of the crop and water body are all critical determinants of the potential exposure. The co-occurrence of sensitive variables is an issue that the group plans to incorporate into subsequent deliberations.
| Physical Aspects | Agronomic aspects | Water Body Factors | Weather Variables | Spatial Factors | Model Issues |
|---|---|---|---|---|---|
Land area Land area/water area Scale Basin Geometry Range of distances from treated land to water Homogeneity of soil textures Homogeneity of soil OM%, pH etc Range of slopes Uniformity of slopes within watershed Complexity of slopes and related depressions within fields (micro-relief) Presence of ditches or rills to transport runoff Complexity of drainage network [if scale medium to large] |
Area in agriculture, urban development etc Area in crop of interest Ag area/water area Crop area/water area Presence and width of Buffers Composition of buffers Requirement for & width of set backs Extent of "pesticide of interest" usage Use of same pesticide for other use patterns (e.g. urban lawns) Adoption of conservation tillage practices Presence of "engineering controls" (e.g. terracing) Extent of chanellization in rills and water body entry points Presence of tile drainage Relative spatial positioning of crop and water body (e.g. relative to wind) Crop vigor and density Crop planting date & growth rate |
Area Depth Volume Shape Flow in/out (controls) Return flow Bank Storage No of RO entry points Representativeness within region Marginal vegetation Natural or man-made pond, lake or reservoir Self sustaining or manipulated (catfish pond) Range of species represented Stream order/pond class Tile drainage entry?? |
Prevailing wind direction and speed Range of wind speeds and directions Storm frequency Storm intensity Storm hyetograph (typical hydrograph) Temperature change with time |
Relative positioning of crop of interest and water body Do all entries deliver from treated areas? Extent of differences between regions |
Suitability of watershed/water body for existing models |
GENEEC Status and Plans
In the current regulatory tiered process for aquatic risk assessment; GENEEC, a meta-model of PRZM-EXAMS output is used as the regulatory touchstone to estimate exposures for comparison with "worst case" aquatic toxicity values to determine whether further risk characterization effort is warranted. The ECOFRAM Aquatic Exposure Subgroup is seeking to rationalize the tier system but during debates decided that GENEEC might serve as an interim first tier "worst-case assumption" model in the new system. Accordingly the group decided to summarize its thoughts on GENEEC.
General Advice
It is a "meta-model" of PRZM-EXAMS
It uses "high-exposure" assumptions
There is a general level of comfort using this for row crops at tier 1 as described
This comfort level does not apply to rice, cranberries and rights-of-way
The group do not see replacing GENEEC as Tier 1 as a high priority
However, this decision may have costs to EPA in that GENEEC is "too severe" and refers too many compound/uses for further work
GENEEC should be a simple "trigger"
Either a "pass" or move directly to tier II to perform more detailed assessments
Do not try to "tweak" GENEEC parameters on a compound specific basis
Recommendations for how to develop/maintain GENEEC
EPA should do some "validation" or "confidence building" for the risk managers in EPA and industry
GENEEC should be made an official EPA model
The group recommends that a "EURO-GENEEC" be developed using a similar background to US GENEEC but using different assumptions
GENEEC should be re-examined (and recoded as needed) using latest PRZM and EXAMS code in mid 1998 after FEMVTF has fed back initial results
Add necessary code to address requests for additional output from ECOFRAM Aquatic Effects Group
e.g.. water column curve shapes
Develop and validate specific turf and muck soil modules
These will not be meta-model modules
Perform further development for rice, cranberry and rights
More / Improved Data Needed to Support Exposure Modeling
In 1993, the FIFRA Exposure Modeling Workgroup (FIFRA EMWG) developed a list of environmental fate studies that needed study design improvement or inclusion in the FIFRA requirements in order to supply the information needed for exposure modeling. The ECOFRAM Aquatic exposure Subgroup has endorsed that list and added on or two points.
Suggested changes
Rate constants for degradate formation and decline should be measured
Rate constants for hydrolysis should be measured as a function of temperature where needed.
Quantum yields should be measured in photolysis studies
Multiple soils (at least 4 relevant soils) should be used to determine laboratory aerobic degradation half lives
Adsorption/Desorption study design needs to be improved to reflect "real world" desorption timing and impact of residue "aging"; desorption kinetics may also be important in some cases
Aquatic fate/metabolism studies should be conducted where runoff is likely to be significant
Foliar dissipation and washoff studies are essential for foliar pesticides
The inclusion of subsoil degradation rate studies should be included where appropriate
In some cases, the impact of plant uptake should be considered
There is limited interest in including studies to determine the dependence of soil degradation rate on temperature and moisture level.
The subgroup has suggested that, in addition to the suggested changes, some of the studies in subpart N could effectively be placed into tiers I order to concentrate effort on those aspects of those compounds that merit the intense scrutiny.
Affiliations
Zeneca Ag. Products, 1200 South 47th Street - Box 4023, Richmond, CA 94804-0023
Iowa State University, Department of Agricultural and Biosystems Engineering, Davidson Hall, Ames, IA 50011
US EPA-ORD/NERL, 960 College Station Road, Athens, GA 30605-2700
US EPA-OPP, Environmental Fate and Effects Division (7507C), 401 M Street, SW, Washington, D.C. 20460
Novartis, Ecological Toxicology, PO Box 18300, Greensboro, NC 27419-8300
US EPA-OPP, Environmental Fate and Effects Division (7507C), 401 M Street, SW, Washington, D.C. 20460
USGS, MS413, 12201 Sunrise Valley Dr., Reston VA 20192-0001
DuPont Ag. Products, Barley Mill Plaza, Building 15/1118, Rt. 48 and Rt. 141, Wilmington, DE 19805
Scientific Evaluation Section, Bureau of Pesticides, 3125 Conner Boulevard, Tallahassee, FL 32399-1650
Waterborne Environmental, 897-B Harrison Street, S.E., Leesburg, VA 20175
US EPA-OPP, Environmental Fate and Effects Division (7507C), 401 M Street, SW, Washington, D.C. 20460
The ECOFRAM Aquatic Exposure Group would also like to acknowledge contributions made by Ron Parker (US EPA-OPP) and Paul Mastrodone (US EPA-OPP).