Using R, spsurvey,
and Tinn-R
for Monitoring
Design and Analysis
The purpose of this document is to describe how to acquire and install software necessary for selecting sites as part of the design of a monitoring program and for completing statistical analyses of the subsequent data. By following the instructions, a reader can expect to have the software ready to use and to have a very brief introduction on how to use it.
What is R?
R is a language and environment for statistical
computing and graphics. It is based on the S language and environment which was
developed at Bell Laboratories (formerly AT&T, now Lucent Technologies) by
John Chambers and colleagues. R provides a wide variety of statistical (linear
and nonlinear modelling, classical statistical tests,
time-series analysis, classification, clustering, ...)
and graphical techniques, and is highly extensible. The S language is often the
vehicle of choice for research in statistical methodology, and R provides an
Open Source route to participation in that activity. R is available as Free Software and runs on
Windows.
R is an integrated suite of software facilities
for data manipulation, calculation and graphical display. It includes
- an effective data
handling and storage facility,
- a suite of operators
for calculations on arrays, in particular matrices,
- a large, coherent,
integrated collection of intermediate tools for data analysis,
- graphical facilities
for data analysis and display either on-screen or on hardcopy, and
- a
well-developed, simple and effective programming language which includes
conditionals, loops, user-defined recursive functions and input and output
facilities.
The ability to add new statistical algorithms, through
user-developed libraries, is one of its greatest features. This is a major reason for our use of R.
Why use R
for Aquatic Monitoring Survey Design and Analysis
- Needed way to provide survey design and survey analysis
algorithms to others (particularly states and tribal nations)
- No existing statistical software has the algorithms required
- Many organizations have limited ability to purchase any
recommended commercial statistical software
- R is free, easily installed, and usable with training
- Our approach is to provide libraries that minimize knowledge
required about R
Joint use of R, spsurvey and Tinn-R
To use R for monitoring survey design and analysis requires
a specific R library – spsurvey – developed by the
ARM Design Team. Both R and spsurvey can be downloaded from the ARM web site. spsurvey
uses another library developed by others and is also available from the ARM web
site. No additional software is
required. We have found it useful to use
another program, a text editor Tinn-R, which has been
designed to work with R. It can also be
downloaded from the ARM web site.
Acquiring R, spsurvey, sp, and Tinn-R
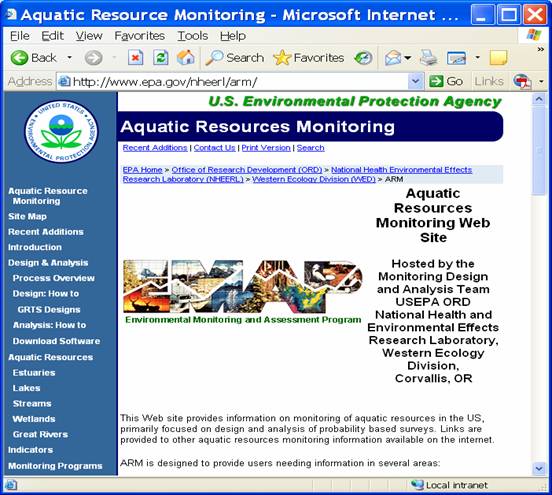
Rather than have users go to several different web sites to download R, spsurvey, and Tinn-R, we have made them accessible from the ARM web site. This also allows us to make sure that the software versions are compatible. If you want to download R or other libraries for R from the R website, see the appendix. To download from ARM website:
- Go to /nheerl/arm/ and click on “Download Software” in the left column (or go directly to: /nheerl/arm/analysispages/software.htm)
- Right click on R-2.15.0-win.exe to download the R windows installer and place on desktop (may put in any location you wish but remaining instructions assume it is on your desktop)
- Right click on spsurvey_2.4.zip to download the spsurvey library and place on desktop (may put in any location you wish but remaining instructions assume it is on your desktop). Do NOT unzip!!!
- Right click on sp_0.9-99.zip to download the sp library and place on desktop (may put in any location you wish but remaining instructions assume it is on your desktop). Do NOT unzip!!!
- Right click on Tinn-R_2.3.7.1_setup.exe to download the Tinn-R windows installer and place on desktop (may put in any location you wish but remaining instructions assume it is on your desktop)
Other files on the Aquatic Resources Monitoring –
Software web page are:
- How to install R, spsurvey, and Tinn-R (this document)
- A user guide for the spsurvey library
- Changes to the spsurvey library
- Spatial survey design examples for points, lines, and polygons,
i.e., finite, linear, and areal aquatic resources
At this point all necessary software is now located on your desktop.
Installing R
- Uninstall previous versions of R, if any (Not absolutely
necessary)
- Close all other programs (safety precaution)
- Install the downloaded file by double clicking the R-2.15.0-win.exe desktop icon. It is a Standard Windows installer. You may need to have administrator
privileges to do the install. If
so, contact your systems administrator.
May take 5-10 minutes to complete installation
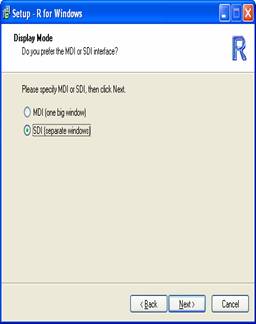
- Windows installer goes through series of windows. Recommend that use default options except
for the following two windows:
- Startup Options: Specify
Yes to customize.
Then select SDI option. SDI option required when use Tinn-R

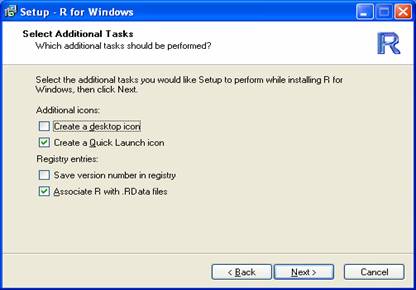
- Select Additional Tasks (see window below). Have options:
- Place an R icon on the desktop (check if you want a desktop
icon)
- Create a Quick Launch icon (check if you want a Quick Launch
icon)
- Save version number in registry (if checked, then you must
have Administrator privileges to uninstall R)
- Associate R with .RData files (make
sure this is checked)
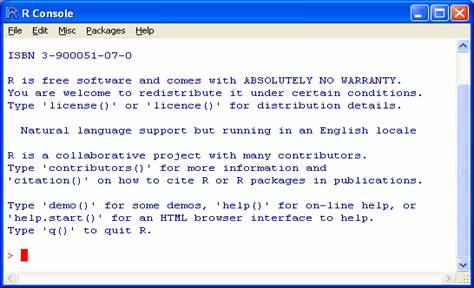
Starting R
R may be started several ways
- Double click the R desktop icon (if created)
- Click the Quick Launch icon in Start window (if created)
- Double click on an “.RData” file
created during an R session (more later on “.RData”
files
The window below appears when R is
started.
Installing R library packages
Two steps are necessary to use an R library: (1) installing the package and (2) loading the package. Installing a package only is done once. The package must be installed again if a new version of R is installed. Loading a package must be done every time R is started and it is required for your analysis.
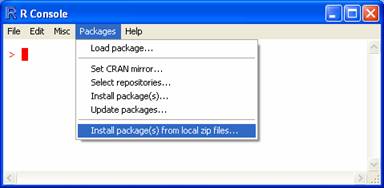
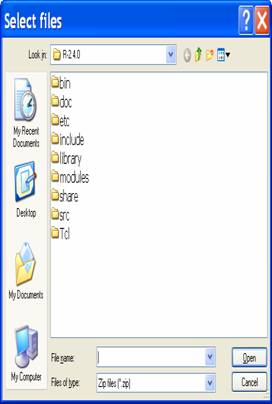
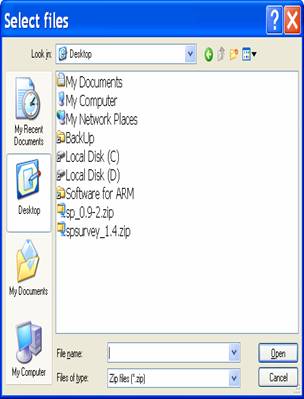
To install spsurvey or sp libraries that are located on your desktop (or other folder), click on Packages on main menu and click on Install package(s) from local zip files…. Locate the spsurvey or sp zip file using the dialog windows, select the zip file and click Open to complete installation. Must do each package separately and must install the sp package prior to installing the spsurvey package.
To load a package, click on Load package… in the Packages
pull-down menu. Then select the package
from the popup window. 

Library packages may also be loaded using the R command library(name) where name is the name of the package (e.g., sp or spsurvey). More about R commands later.
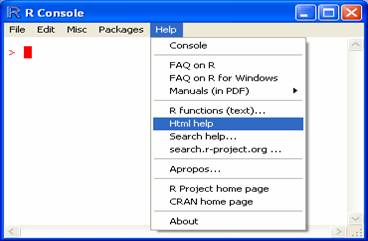
Accessing the R Help System
The Help pulldown
menu has several help features. A very
useful help feature is Html Help.
It uses your web browser to display help about R, R commands, and R
library packages.

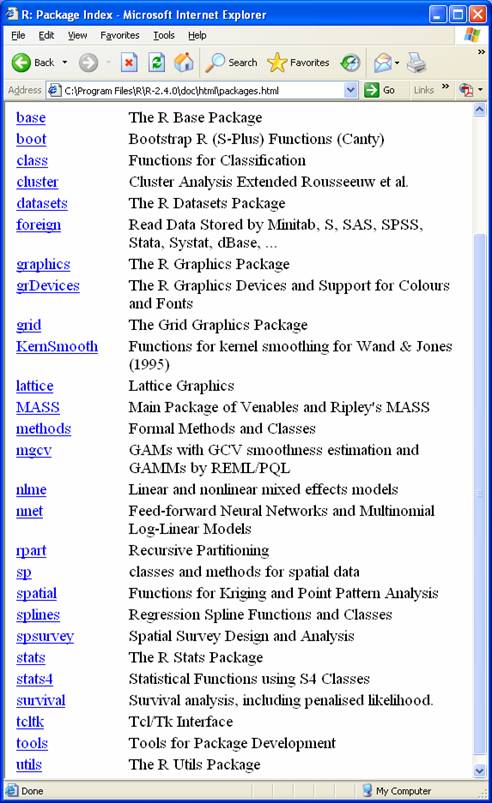
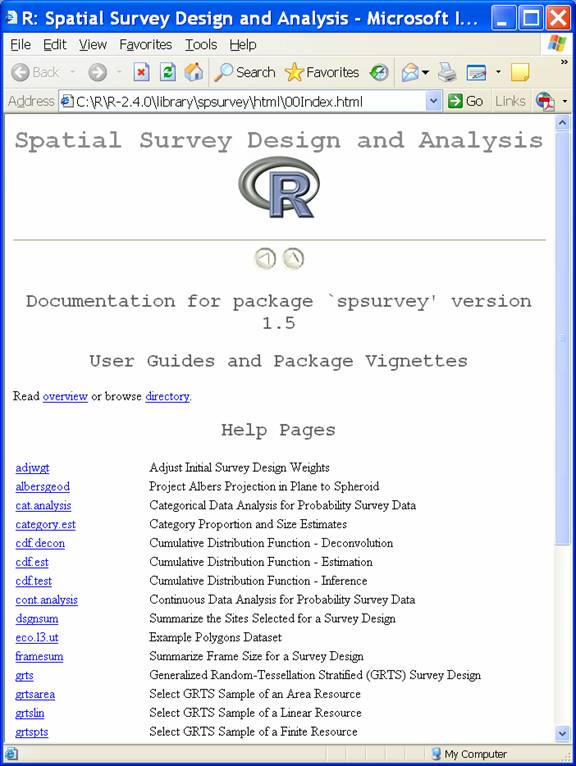
Clicking on Manuals provide access to the R manuals. Clicking on Packages gives a list of available packages. Clicking on a package name will give a list of commands available in that package. See two windows below. The second window shows a partial list of the commands (functions) available in spsurvey.
A help file is available for each of the
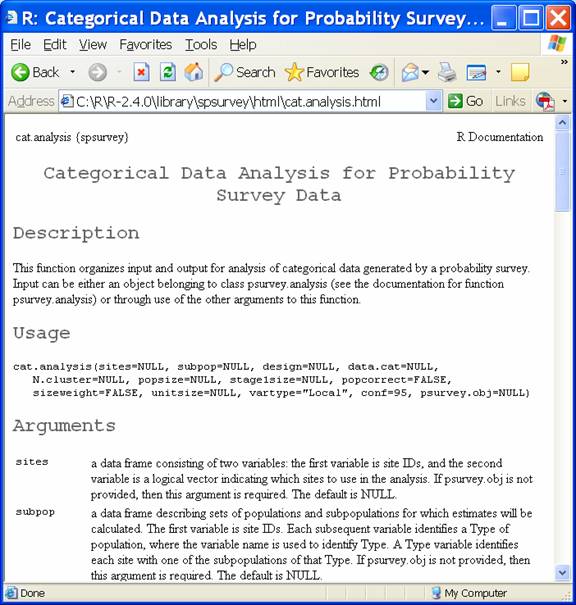
user-available function in spsurvey. For example if click
on cat.analysis the help file to do
population survey estimates for categorical data appears.
Installing Tinn-R editor
Tinn-R is a text editor designing to work seamlessly with R. It recognizes R commands/functions, does automatic matching of parentheses, and has icons that execute R script you create in Tinn-R. An advantage of using Tinn-R is that you can preserve the R script you created to do a survey design or survey analysis. If your input data changes, it is simple to redo an entire analysis without changing any of the R script. The saved script file can also be used for QA purposes.
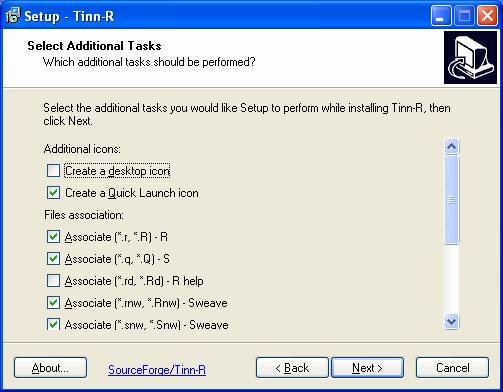
To install Tinn-R, double click on Tinn-R_2.3.7.1_setup.exe to begin the Windows Installer. On the Select Additional Tasks window, you have options to create a desktop icon and a Quick Launch icon. Check options you prefer. Keep all default file associations.
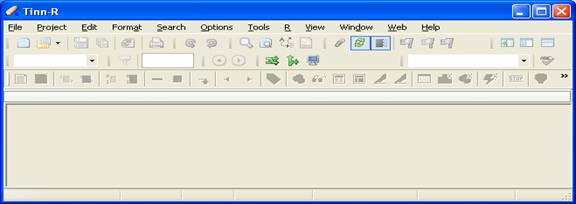
The installation ends with an option to start Tinn-R. When Tinn-R starts it looks as follows IF R is not running:
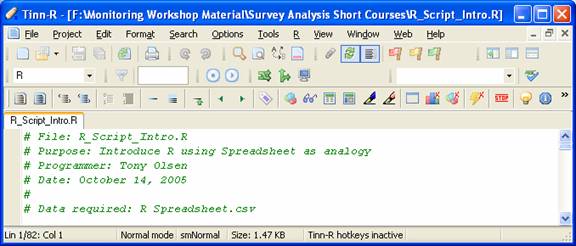
If R is running, then Tinn-R looks as follows:

Note the lowest tool bar has some icons in color. This tool bar is associated with R. By placing the cursor over each icon information about what clicking the icon does with R is given.
When open an R script file, other icons on the tool bar become active.
Windows Topics
It is useful to save files from Excel using a tab delimited format to read into R. One reason is that it is unusual to have a tab in a data file and common to have a “,” appear in a name. Such commas cause problems when reading a csv file in R. To make it easier to open tab-delimited files, it is useful to change their file extension to “.tab” and to assign the “.tab” file extension to be opened by Excel. This can be done using Folder Options under the Tools pull-down menu.

Begin a Survey Design or Survey Analysis for a Project
- Create a new folder for the survey design or
survey analysis task
- Recommend creation of a
subfolder named “Original Data”
§
Place
any original data files in this folder
§
Never
change these files
- Double click the R desktop icon
or quick launch icon to start R
- Under the R File menu,
§
Click
Change Dir …
§
Click
Browse, scroll to find your project directory and click on it, then click OK
- When done using R, click Exit under the File menu
and click YES when asked “Save workspace image?”.
- When you want to start R again
to work on this project, go to its project folder and open the “.RData” file.
Executing Commands in R
- Three options to execute
commands in R
§
Type
commands in console window
•
Window
automatically opens when R starts
•
Commands
execute by pressing the “Enter” key
§
Use the
script window in R
•
Under
File menu either create New or Open existing script file
•
Type
commands in the script window
•
To
execute commands, copy and paste into the console window
•
Close
window and save to project directory
•
Use
saved script file when you want to continue work on the same project
§
Use
another text editor program
•
Type
commands in editor
•
Copy
and paste into the console window
- Advantages of R script window or
text editor approach
§
Can
save all your commands in both cases
§
Some
text editors recognize R language and structure making it easy to locate errors
(e.g., Tinn-R)
§
Can redo
the analysis if there are changes to the data
§
Can
set up an example analysis and use as a template for other analyses
§
Aid
in QA for analysis process
Things to remember in R
·
Column
names may be modified in R
§
“blanks” will become “.”
§
Unusual
characters will become “.”
§
Unusual
character at the beginning (e.g., %) will change to “X.”
·
Blanks
in spreadsheet will be turned into missing data
·
“NA”
in spreadsheet will be interpreted as missing data, except when column is
character
·
Everything
after “#” is ignored, which can be
overridden
·
Reading
a comma-separated value (csv) file may result in
unanticipated results if columns contain “,” in character fields (recommend use
of tab-delimited files instead)
Downloading R from R-Project Website
Use a web browser to access: http://r-project.org/. Select a CRAN mirror site near your
location. Illustration is from a site in

Click Windows
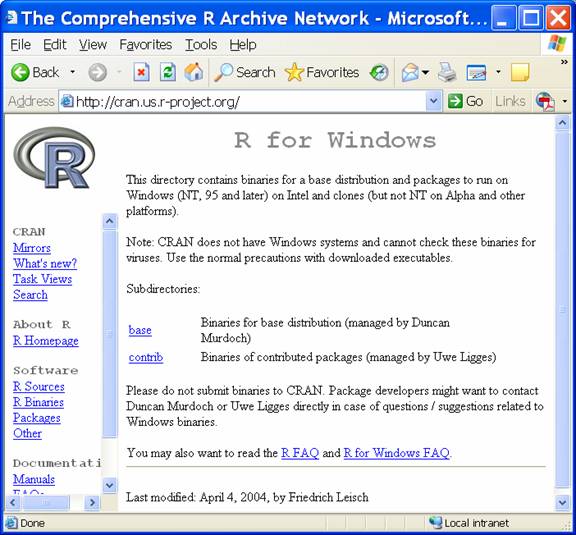
Click base
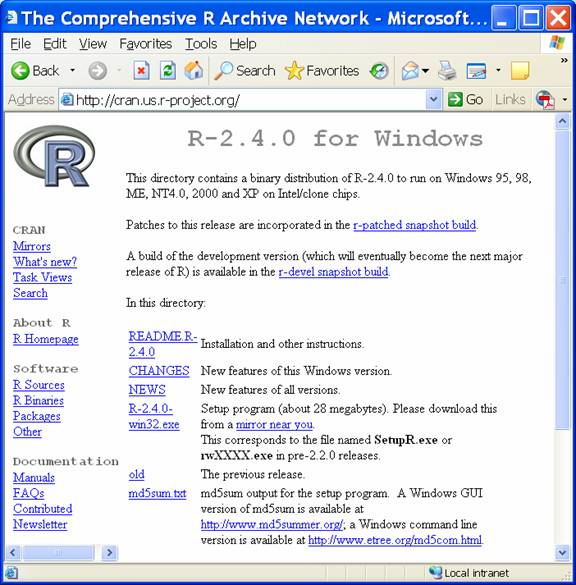
Click R-2.15.0-win.exe

Click Save

Click Desktop
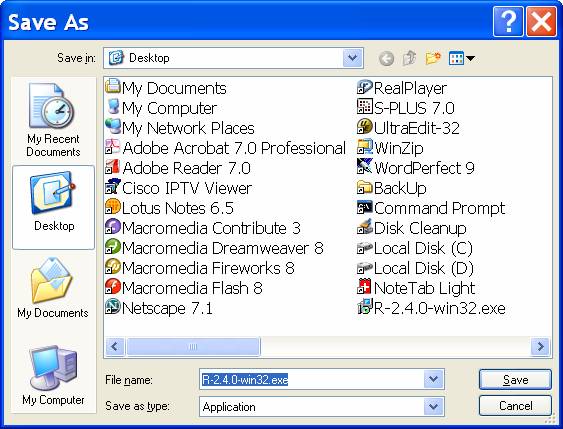
Click Save