Summary of Results for the 2002 National-Scale Assessment
INTRODUCTION
Of the 181 air toxics included in the 2002 national-scale assessment, the risk characterization considers the risk of both cancer and noncancer effects from inhalation of 124 of these air toxics -- the subset of pollutants with health data based on chronic exposure. The purpose of this national-scale assessment is to understand these cancer risks and noncancer health effects in order to help the EPA and others to identify pollutants and source categories of greatest potential concern, and to set priorities for the collection of additional information to improve future assessments. The assessment represents a "snapshot" in time for characterizing risks from exposure to air toxics. The national-scale assessment is not designed to characterize risks sufficiently for regulatory action.
The 2002 national-scale risk assessment is based on a 2002 inventory of air toxics emissions (the most complete and up-to-date available). It then assumes individuals spend their entire lifetimes exposed to these air toxics. Therefore, it does not account for the reductions in emissions that have occurred since 2002 or those that will happen in the near future due to regulations for mobile and industrial sources (see further details in the Air Toxics Reduction section of the Web site). This risk assessment represents an update and enhancement to EPA's 1999 national-scale assessment. The next assessment will focus on emissions for the year 2005. It will be released in late 2009 or early 2010.
Note that in this assessment, the potential carcinogenic risk from diesel PM is not addressed because there currently is no unit risk estimate available. There are noncancer results. Learn more about EPA's qualitative assessment of diesel PM.
Given its broad scope, this risk characterization is subject to a number of limitations due to gaps in data or in the state of the science for assessing risk. For example, the current assessment does not yet include results for dioxins, compounds that may contribute substantially to risks. In addition, the EPA is reassessing the health effects of many pollutants considered in this study. A status report for all EPA health effect assessments is available at cfpub.epa.gov/iristrac/index.cfm. For more details about the limitations in the risk characterization, refer to the limitations section on the Web site.
The risk characterization, which was limited to inhalation risk from outdoor sources, was designed to answer the following questions:
- Which air toxics pose the greatest potential risk of cancer or adverse noncancer effects across the entire United States?
- Which air toxics pose the greatest potential risk of cancer or adverse noncancer effects in some areas of the United States?
- Which air toxics pose lesser, but still significant, potential risk of cancer or adverse noncancer effects across the entire United States?
- When risks from all air toxics are combined, how many people have the potential for an upper-bound lifetime cancer risk greater than 10 in a million?
- When potential adverse respiratory or neurological effects from all air toxics are combined, how many people have the potential for exposures that exceed reference levels intended to protect against adverse effects (i.e., a target organ-specific hazard index greater than 1.0)?
SUMMARY OF RESULTS
Based on a comparison of the cancer and noncancer risks estimated for the 124 air toxics quantified by the 2002 national-scale assessment, it is possible to determine which air toxics pose the greatest potential risk in the United States. A summary of these findings are reported below. Cancer risks in this assessment are presented as lifetime risks, meaning the risk of developing cancer as a result of exposure to each air toxic compound over a normal lifetime of 70 years. Noncancer risks are presented in terms of the ratio between the exposure and a reference concentration. This ratio is called the hazard quotient. The risk characterization summary below focuses on results at the national level, where the EPA believes the results are most meaningful.
| EPA assessed 80 of the air toxics as carcinogens. |
| Number of Air Toxics with WOE Classification* and Unit Risk Estimate |
| Carcinogenic to humans - 9 |
| Likely carcinogenic to humans - 49 |
| Suggestive evidence of carcinogenic potential - 12 |
| Unit Risk Estimate only - 9 |
| Range from Likely to not likely carcinogenic to humans - 1 (includes the 8 Groups of PAH) |
| * Based on the 2005 Cancer Guidelines. For ease of presentation, the WOE scheme under the 1986 Cancer Guidelines are combined with the new scheme, i.e., A = Carcinogenic to humans; B1 and B2 = Likely carcinogenic to humans; C = Suggestive evidence; D = Inadequate information; E = Not likely carcinogenic to humans. |
To help understand the results, it should be noted that:
- Concentration results (ambient and exposure) are provided for 181 air toxics
- Cancer results are presented for 80 air toxics that have quantitative dose-response information
- Noncancer results are presented for 68 air toxics with quantitative dose-response information
- Only the respiratory and neurological noncancer hazard quotients are presented (these organ systems were the noncancer drivers in previous assessments)
- Many noncancer reference concentrations incorporate protective assumptions designed to provide a margin of safety. A hazard quotient greater than one does not necessarily suggest a likelihood of adverse effects. A hazard quotient equal to or less than one, however, suggests that exposures are likely to be without an appreciable risk of noncancer effects during a lifetime. Furthermore, the hazard quotient cannot be translated into a probability that an adverse effect will occur, and is not likely to be proportional to risk
For more information on the specific organ or organ systems adversely affected by the air toxics in this assessment, go to the table in Health Effects Information (PDF) (12pp, 82k).
The following conclusions on individual air toxics compounds were drawn from the risk characterization.
The following Table presents the criteria for classifying the NATA 2002 air toxics and will be helpful in understanding the conclusions below. In general, drivers and contributors are defined as air toxics showing a particular level of risk or hazard for some number of people exposed. They are also presented in order of their cancer weight-of-evidence (WOE) classification, (i.e., beginning with "carcinogenic to humans").
2002 NATA Health Effects Drivers and Contributors Risk Characterization
| Risk Characterization Category |
Risk Exceeds (in a million)1 | HI > 1.02 | Number of People or Greater Exposed (in millions) |
|---|---|---|---|
| National Cancer Driver | 10 | 25 | |
| Regional Cancer Driver | 10 | 1 | |
| Regional Cancer Driver | 100 | 0.01 | |
| Nationl Cancer Contributer | 1 | 25 | |
| Regional Cancer Contributer | 1 | 1 | |
| National Noncancer Driver | 1.0 | 25 | |
| Regional Noncancer Driver | 1.0 | 0.01 |
1Cancer risks are upper-bound lifetime cancer risks, i.e., a plausible upper limit to the true probability that an individual will contract cancer over a 70 year lifetime as a result of a given hazard (such as exposure to a toxic chemical). This risk can be measured or estimated in numerical terms (e.g., one chance in a hundred).
2HI = The sum of hazard quotients for substances that affect the same target organ or organ system. Because different pollutants may cause similar adverse health effects, it is often appropriate to combine hazard quotients associated with different substances to understand the potential health risks associated with aggregate exposures to multiple pollutants.
- National cancer risk driver:
- Benzene: "carcinogenic to humans".
- Regional cancer risk drivers:
- 1,3-butadiene, arsenic compounds, chromium 6, coke oven emissions: All "carcinogenic to human".
- hydrazine, tetrachloroethylene, PAHs: "likely carcinogenic to humans" (Note that the WOE for the PAHs in the 8 groups range from "likely" to "not likely carcinogenic to humans").
- Naphthalene: "Suggestive evidence of carcinogenicity".
- National cancer risk contributors:
- 1,4-dichlorobenzene, acetaldehyde, acryonitrile, carbon tetrachloride, ethylene oxide : All considered "likely carcinogenic to humans".
- Regional cancer risk contributors:
- nickel compounds: "carcinogenic to humans"
- 1,3-dichloropropene, beryllium compounds, cadmium compounds, methylene chloride: all "likely carcinogenic to humans"
- 1,1,2,2-tetrachloroethane: "suggestive evidence of human carcinogencicity"
- N-nitrosomorpholine, methyl tert-butyl ether: No EPA WOE classifications.
- National noncancer hazard drivers:
- acrolein .
- Regional noncancer hazard drivers:
- 2,4-toluene diisocyanate, chlorine, chromium compounds, diesel engine emissions, formaldehyde, hexamethylene diisocyanate, hydrochloric acid, manganese compounds, nickel compounds. (Note that the capability of the study to find potential hotspots in small regions of the country is limited by the tools used in the study, making it possible that some regional hazard drivers may have been overlooked).
The following conclusions on simultaneous exposure to all air toxics compounds were drawn from the risk characterization
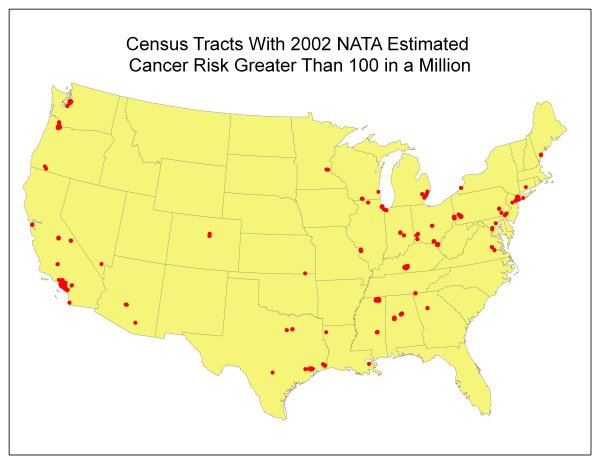
Cumulative Cancer Risks: The EPA added the cancer risks from all air toxics compounds listed as carcinogenic or likely carcinogenic to humans. More than 284 million people live in census tracts where the combined upper bound lifetime cancer risk from these compounds exceeded 10 in one million risk and more than 2 million people live in census tracts where the combined upper bound lifetime cancer risk from these compounds exceeded 100 in one million risk. The overall national average risk in the U.S. is 36 in a million.
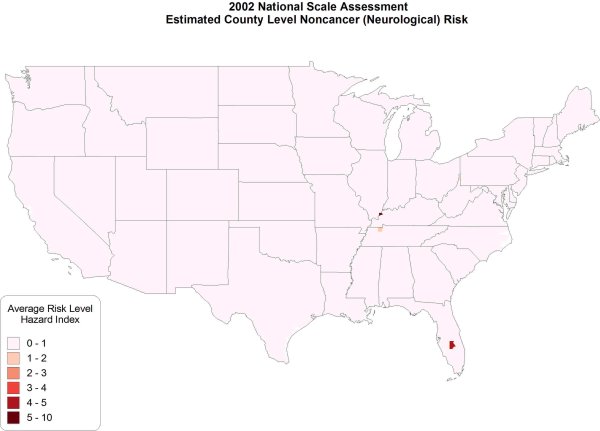
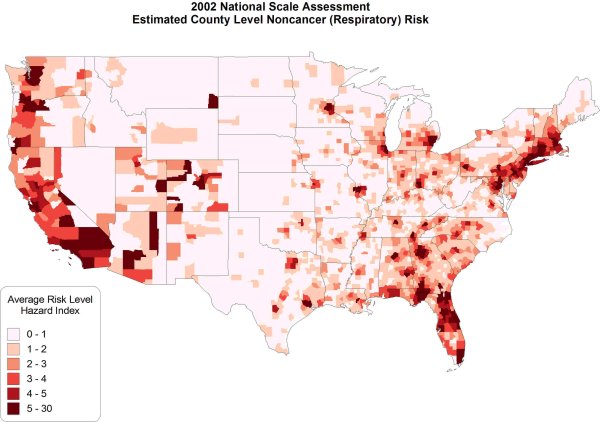
Cumulative Noncancer Hazards: Ideally, hazard quotients should be combined for pollutants that cause the same adverse effects by the same toxic mechanism. However, because detailed information on mechanisms was unavailable for most of the substances considered in this assessment, the EPA used a simpler and more conservative method. Many of the pollutants in this assessment cause adverse effects in humans or animals by irritating the lining of the respiratory system or by causing various effects to the nervous system. Although it is not clear that these respiratory and neurological effects occur by the same mechanisms for all such air toxics compounds, the EPA protectively assumed that these effects could be added. These additive effects were represented by a "hazard index," which is the sum of the hazard quotients of the air toxics compounds that affect the respiratory or nervous system. The respiratory hazard index was dominated by a single substance, acrolein. The respiratory hazard index exceeded 1.0 for nearly the entire U.S. population, and exceeded 10 for more than 22 million people. The neurological hazard index was similarly dominated by manganese compounds, with minor contributions by cyanide compounds, ethylene oxide, and mercury compounds. The neurological hazard index exceeded 1.0 for fewer than 350,000 people in the U.S.
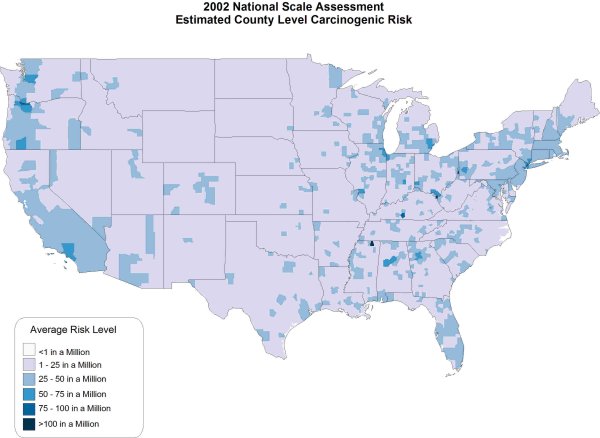
Summary Risk Maps (Note: Hawaii, Alaska, and the Virgin Islands are not included on these maps although they were included in this 2002 NATA.)
Estimated County Level Carcinogenic Risk (PDF) (1pg, 2.1 MB) - PDF version of map below.
Estimated County Level Noncancer (Neurological) Risk (PDF) (1pg, 2.1 MB) - PDF version of map below.
Estimated County Level Noncancer (Respiratory) Risk (PDF) (1pg, 2.1 MB) - PDF version of map below.
Census Tracts with 2002 NATA Estimated Cancer Risk Greater than 100 in a Million (PDF) (1pg, 104k) - PDF version of map below.