Estrogen Receptor (ER) Expert Systems for Chemical Prioritization
You will need the free Adobe Acrobat Reader to view
some of the files on this page.
See EPA's
PDF page to learn more about PDF, and for a link to the free Adobe Acrobat
Reader.
The Food Quality Protection Act of 1996 requires the US EPA to screen pesticidal actives and inert ingredients for the potential to act as endocrine disruptors. Given the significant time and money required to conduct hazard assessments for the large numbers of chemicals covered by this mandate, there is a need for a strategic approach to prioritize chemicals to be nominated to move forward into higher tiered targeted testing. One approach being taken to address this need is through decision support tools called “expert systems” that are founded on quantitative structure activity relationships (QSAR) and development of effects-based chemical categories. Expert Systems are automated rule-based decision trees that can be used to predict which chemicals have the potential to disrupt endocrine systems. This is done by testing key chemicals within a chemical group to represent others, determining what is similar about the chemical structures and properties that explain their similar biological activity, and writing rules that help predict the activity of untested chemicals that fit the parameters of the chemical group. The ER Expert System (ERES) developed at the USEPA, NHEERL, Mid-Continent Ecology Division (MED) used the OECD QSAR Validation Principles to maximize transparency and usefulness by using well-defined endpoints in well-characterized assays that are appropriate for testing the types of chemicals on EPA inventories, and striving for a mechanistic understanding of all assay results (Hornung et al., 2014; Schmieder et al., 2014).
The conceptual approach providing the foundation for the expert system is the description of the chemically-initiated perturbation of the ER system in fish within the framework of an adverse outcome pathway (AOP). The ER-mediated reproductive impairment AOP (Figure 1; Schmieder et al., 2004) describes the linkage between the event that initiates the pathway (e.g., a chemical binding the ER) and measures made at successively higher and more complex levels of biological organization. The pathway progresses from the molecular initiating event (MIE), through cell and tissue level gene transcription and translation, continuing through organ effects to an adverse outcome observed in the individual and/or population. With a plausible pathway to an adverse outcome described, a rationale is provided for using chemical interaction at the MIE as a basis for prioritizing chemicals for further screening using in vivo assays which incorporate endpoints at higher levels of biological organization.
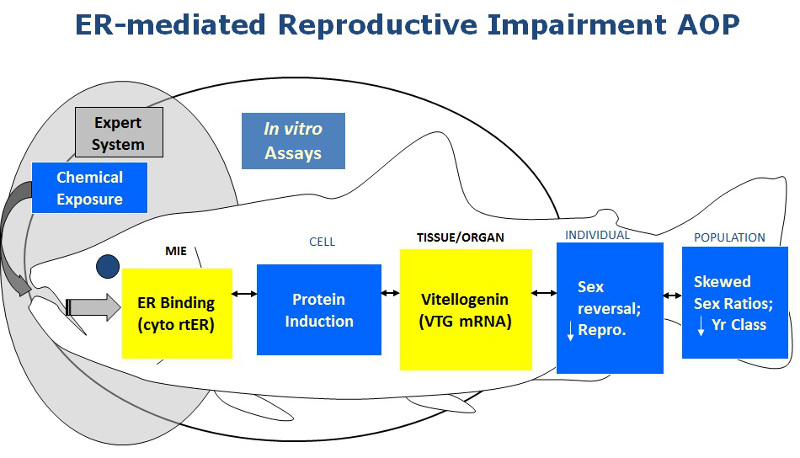
Figure 1. The in vitro assays used at MED to develop the ERES (yellow boxes) are: i) measured chemical binding to the rainbow trout ERα/ß to detect the potential for a chemical to initiate the ERα/ß-mediated pathway; and ii) ERα/ß-mediated vitellogenin induction in rainbow trout liver slices to confirm that ER binding translates to an effect at a point further along the ER-mediated AOP (Schmieder et al., 2004; Hornung et al., 2014; Schmieder et al., 2014).
2009 ERES SAP
In August 2009, the effects-based chemical category approach developed using the in vitro assays within the ER-mediated AOP, and presented as the ER Expert System (ERES) decision trees and logic rules, titled: The Use of Structure Activity Relationships of Estrogen Binding Affinity to Support Prioritization of Pesticide Inert Ingredients and Antimicrobial Pesticides for Screening and Testing, was presented to a FIFRA Science Advisory Panel (SAP) to obtain feedback on the use of the approach for prioritizing chemicals for further screening (USEPA FIFRA SAP, 2009). The meeting documents and minutes can be downloaded from the following links
- 2009 ER Expert System Document

- Meeting Docket
- Meeting Minutes - (PDF) (72pp 22MB)
2013 EDSP Chemical Prioritization SAP
In January 2013 a FIFRA SAP was convened in which the Agency sought further comment on the concepts, decision logic, and computational (in silico and in vitro) methods used to prioritize chemicals for advancement into the EDSP Tier I screening assays. The document prepared for this meeting, “Prioritization of the Endocrine Disruptor Screening Program Universe of Chemicals for an Estrogen Receptor Adverse Outcome Pathway Using Computational Toxicology Tools”
A set of 295 chemicals that were tested in the ER expert system trout ER binding and liver slice assays and also tested in the ER high throughput (HTP) assays were discussed in Section 7 of the chemical prioritization SAP document. The relative binding affinity (RBA) data for these chemicals derived from the trout ERα/ß competitive binding assay can be accessed in Appendix H in the docket folder from the link above to the meeting documents from the 2013 SAP. The decision process for assigning the chemicals an RBA is presented in Appendix G of the 2013 SAP meeting documents.
ER Expert System in the OECD (Q)SAR Toolbox
In response to the recommendations of a 2009 Organisation for Economic Cooperation and Development (OECD) expert consultation (OECD, 2009) and the 2009 FIFRA SAP, the ERES has been automated and incorporated into the OECD (Q)SAR Toolbox. The Toolbox is a freely available software tool that can be used for assessing the hazards of chemicals for which limited or no hazard information is available. Downloads of the OECD Toolbox containing the initial version of the ERES and associated instructional materials can be accessed at the OECD QSAR Toolbox.
Related References
P.K. Schmieder, M.A. Tapper, J.S. Denny, R.C. Kolanczyk, B.R. Sheedy, T.R. Henry, and G.D. Veith. 2004. Use of trout liver slices to enhance mechanistic interpretation of estrogen receptor binding for cost-effective prioritization of chemicals within large inventories, Environ. Sci. Technol. 38, pp. 6333–6342.
M.W. Hornung, M.A. Tapper, J.S. Denny, R.C. Kolanczyk, B.R. Sheedy, P.C. Hartig, H. Aladjov, T.R. Henry & P.K. Schmieder. 2014. Effects-based chemical category approach for prioritization of low affinity estrogenic chemicals, SAR and QSAR in Environmental Research, 25:4, 289-323.
P.K. Schmieder, R.C. Kolanczyk, M.W. Hornung, M.A. Tapper, J.S. Denny, B.R. Sheedy & H. Aladjov. 2014. A rule-based expert system for chemical prioritization using effects-based chemical categories, SAR and QSAR in Environmental Research, 25:4, 253-287.
J.S. Denny, M.A. Tapper, P.K. Schmieder, M.W. Hornung, K.M. Jensen, G.T. Ankley, and T.R. Henry. 2005. Comparison of relative binding affinities of endocrine active compounds to fathead minnow and rainbow trout estrogen receptors. Environmental Toxicology and Chemistry, 24:11, 2948–2953.
US EPA, Federal Insecticide, Fungicide, and Rodenticide Act (FIFRA) Science Advisory Panel (SAP). 2009. An effects-based expert system to predict estrogen receptor binding affinity for food use inert ingredients and antimicrobial pesticides: Application in a prioritization scheme for endocrine disruptor screening, FIFRA Science Advisory Panel Meeting, Arlington, VA, 2009. White paper available in link above.
US EPA, FFIFRA SAP. 2013. Prioritization of the endocrine disruptor screening program universe of chemicals for an estrogen receptor adverse outcome pathway using computational toxicology tools, FIFRA Science Advisory Panel Meeting, Arlington, VA, 2013. White Paper available in link above.
OECD, 2009. Report of the Expert Consultation to Evaluate an Estrogen Receptor Binding Affinity Model for Hazard Identification.Series on Testing and Assessment, No. 111 (2009) ENV/JM/MONO(2009)33. Available at http://www.oecd.org/env/ehs/testing/seriesontestingandassessmentpublicationsbynumber.htm.
ERES and Training Set Data
ERES DECISION TREE
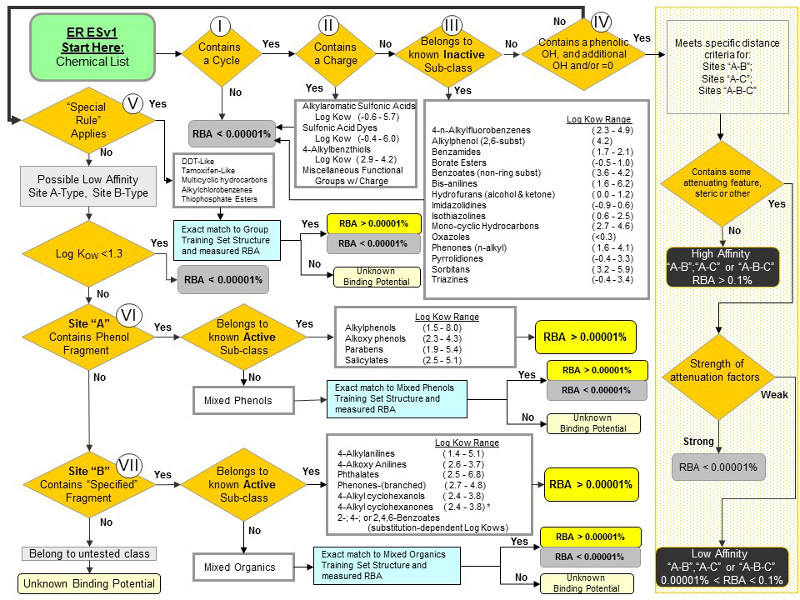
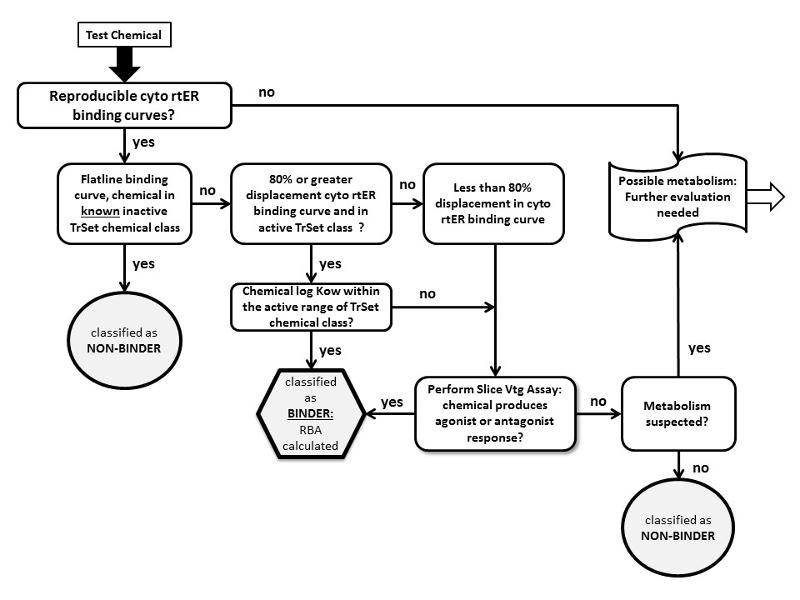
Figure 2. Rule-based ERESv1 decision tree for predicting binding potential for low affinity chemicals to the ER (From Schmieder et al, 2014).
TRAINING SET DATA
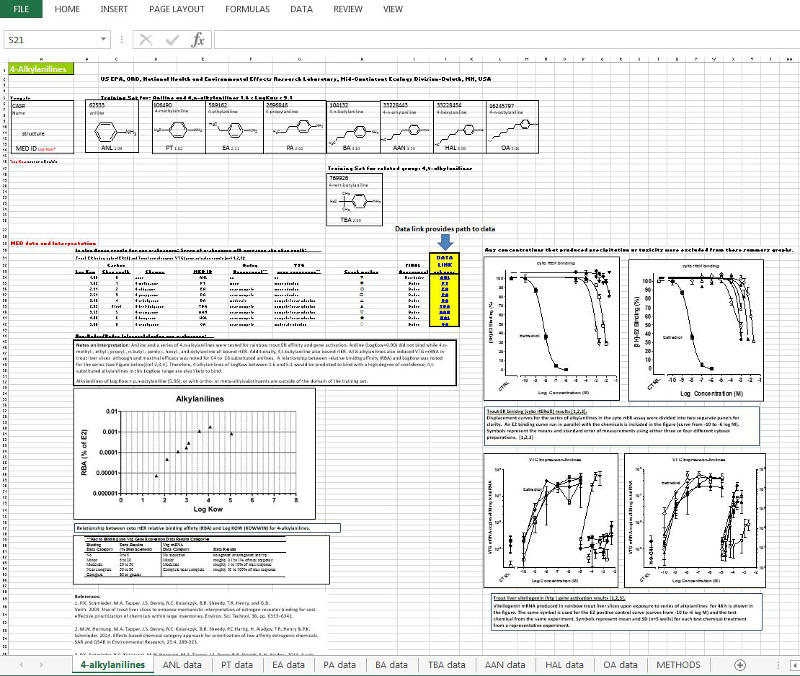
Data used to develop the ERES can be obtained via links in the INSTRUCTIONS FOR OBTAINING DATA section table below. The following screen shots captured from the Excel data file for the 4-alkylanilines are provided here to help orient the user to the layout and structure of these data files that are available for download.
DATA EXAMPLE: Downloaded Excel file with data for each chemical within their chemical group will include:
1. Summary sheet of all chemicals tested within a chemical group, and related chemicals where applicable, with a final assessment of each chemical as an ER BINDER or a NON-BINDER. Notes describing assay interpretations leading to the final determinations are provided. Plots of the RBA vs. Log Kow relationship for the group, and graphs of ER competitive binding displacement and liver slice vitellogenin (Vtg mRNA) induction are included on the summary sheet. The summary worksheet tab has the name of the chemical group. Additional worksheet tabs contain individual chemical data (see #2 below). The example shown is for the ERES ‘Site B’ active group, 4-alkylanilines.
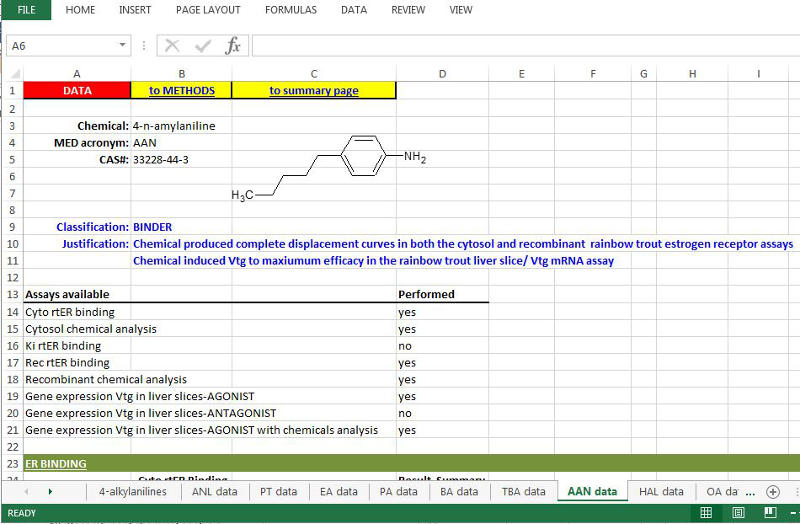
2. Individual chemical data (competitive binding dose-response in comparison to 17ß-Estradiol (E2); IC50s; Relative Binding Affinities (RBA); liver slice Vtg mRNA production with viability assay results (and additional information where applicable) is found by clicking on a chemical’s MED ID (yellow cell ‘DATA LINK’) within the Summary sheet, or the worksheet tab for each chemical of the downloaded file. The chemical structure, CAS and final ‘Classification’ of the chemical as an ER BINDER or ER NON-BINDER, and the rationale used in making the determination are presented first. Next is a list of Assays performed for that chemical, followed by the individual chemical data. All final assessments are also done within the context of the other chemicals within the group and the information on the Summary sheet for that chemical group (See #3 for Decision Scheme). Additional details are found in: Schmieder et al., 2004; Hornung et al., 2014; Schmieder et al., 2014; USEPA FIFRA SAP, 2009; USEPA FIFRA SAP, 2013.
Example of 4-amylaniline information found under “data” tab. More detail about assay METHODS are found under ‘METHODS’ tab (example screen shot not shown);
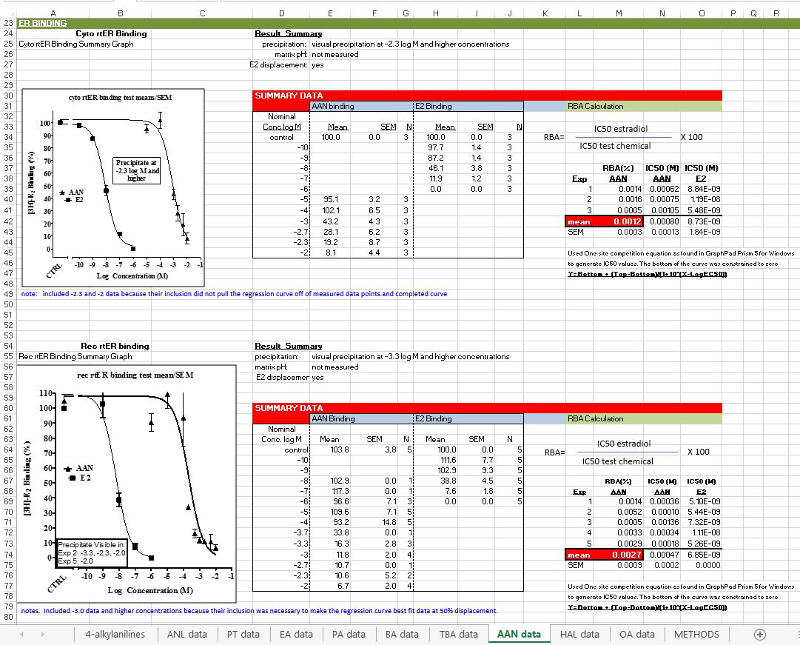
‘ER BINDING’ section: Includes cyto rtERα/ß competitive binding data with additional rec rtERα competitive binding data where applicable (Hornung et al., 2014). Information shown includes: a graph of the chemical’s response compared to E2 run in the same experiments, a table listing of the dose-response data, the formula used for RBA calculations, RBAs and IC50s for each chemical and corresponding E2 runs, and the procedure and equation used for generating IC50s.
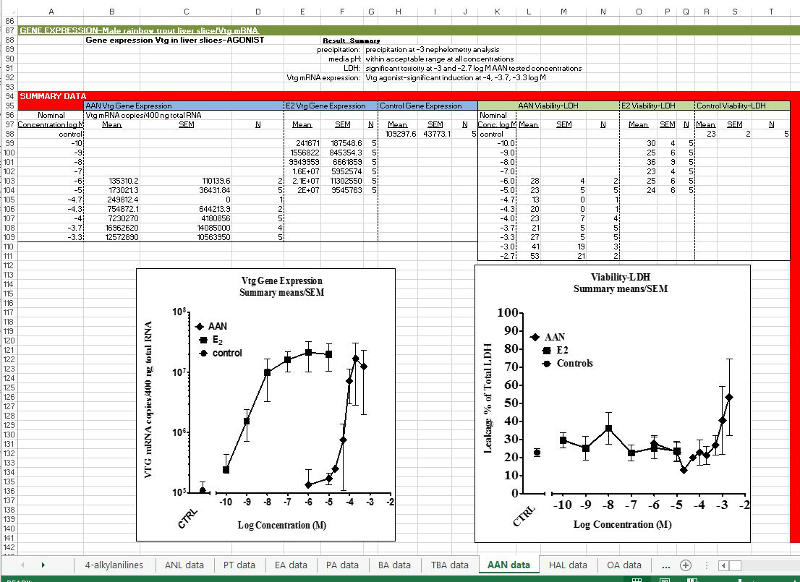
‘GENE EXPRESSION-Male rainbow trout liver slice/Vtg mRNA’ section: Includes Vtg mRNA dose-response data from the trout liver slice experiments for Control, Chemical, and E2. Slice viability assay data for the chemical, and additional media pH and chemical solubility information where applicable, is also shown. For chemicals that produced apparent receptor binding but not significant Vtg mRNA agonist activity, data from experiments run to determine antagonism activity are also included.
3. Decision scheme using a chemical category-based strategy for testing unknown chemicals and assignment as either rtER ‘BINDERS’ or ‘NON-BINDERS’ is shown below and described further in Hornung et al. 2014 and USEPA FIFRA SAP, 2013 (Appendix G). Abbreviations: cyto rtER = rainbow trout estrogen receptor(s) isolated from trout liver cytosol; TrSet = training set chemicals; Vtg = vitellogenin; RBA = relative binding affinity.
INSTRUCTIONS FOR OBTAINING DATA:
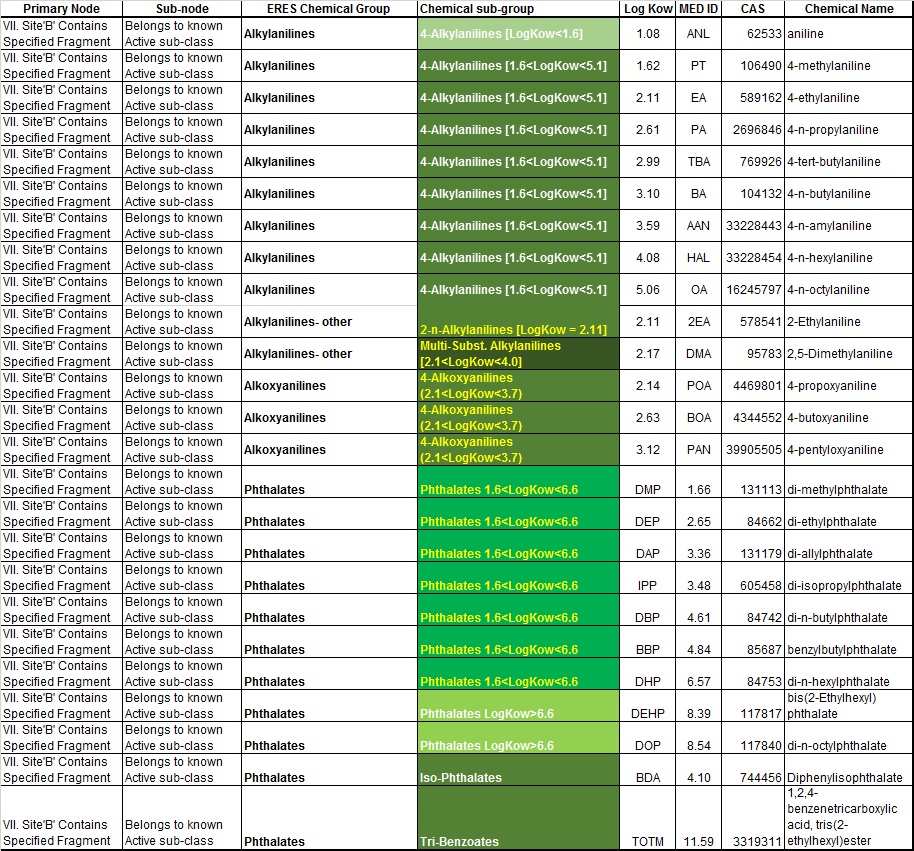
The ERES training set chemicals are listed in the tables below based upon their assignment to nodes I – VII as shown above in the ERES decision tree (Figure 2). Chemicals listed in the tables below are those currently available for download.
Data Download:
Just above each table is a link to download Excel files containing the data for the chemicals within that node. The download for each node includes one Excel file with an ERES Node Table similar to what is shown in the tables below for that node. The download also includes Excel file(s) with data specific to the ERES Chemical Groups within that node.
Working through the downloaded Excel data files:
- Locate chemical of interest in the ERES Node Table file by chemical name, CAS number or MED ID (hint: use ‘Control F’ to find).
- A note above that chemical group in the “ERES Chemical Group” column indicates which Excel file to go to that contains the summary data for that chemical group and data for the individual chemicals in that group.
- In the Chemical Group file, find the chemical of interest in the chemical group Summary worksheet and click on links in that worksheet to open worksheets within that file containing rtERα/ß binding and trout liver slice Vtg mRNA expression data for each chemical (see above in the Data Example section of this webpage).
a. Worksheet tabs labeled “MED ID_data” contain data for individual ER binding and Vtg mRNA assay runs for a given chemical.
b. Worksheet tab labeled “METHODS” lists assays performed and assay methods.
Node I Node II Node III Node IV Node V Node VI Node VII
Node I Check back for updated information
Node II Check back for updated information
Node III Check back for updated information
Node IV Check back for updated information
Node V Check back for updated information
Node VI Check back for updated information
Node VII ERES Node VII download (zip file, 6 MB)
For further information, please contact Michael Hornung (hornung.michael@epa.gov) or Patricia Schmieder (schmieder.patricia@epa.gov).