FIELD PROTOCOL
GPS to plot center
- If Plot center does
not meet the 80-20 decision
rule then: (Jump to does meet 80/20)
- ACCESS ABLE for both directions then SPLIT PLOT. Next.
- ACCESS UNABLE for both 90 degree directions
- Both directions AG or PASTURE fields or Water then SPLIT
PLOT. (Record "pull azimuth and distance" to plot
centers- actual plot coordinates to be calculated in office)
- Both directions for split plot non AG or Pasture fields then
GO TO NEXT PLOT.
- Both directions AG or PASTURE fields or Water then SPLIT
PLOT. (Record "pull azimuth and distance" to plot
centers- actual plot coordinates to be calculated in office)
-
ACCESS UNABLE for one 90 degree direction, ACCESS ABLE for the other 90 degree direction
-
Ag or Pasture field or Water on ACCESS UNABLE side then SPLIT PLOT.
-
For ACCESS UNABLE side, record "pull azimuth and distance" to calculated in office).
-
For ACCESS ABLE side record GPS reading as "source coordinates".
-
-
Non-AG or Pasture or Water on the ACCESS UNABLE side then MOVED PLOT for ACCESS ABLE direction plot.
-
If Plot has homogeneous land cover at 90 degrees in only one direction then:
-
ACCESS ABLE then MOVED PLOT in homogeneous direction
-
ACCESS UNABLE and NON-ag,water,pasture in homogeous direction then GO TO NEXT PLOT.
-
ACCESS UNABLE and either water,ag,or pasture in homogeneous direction then record "pull azimuth and distance" to plot centers from "source coordinates"- (actual plot coordinates to be calculated in office)
-
If Plot center DOES meet the 80-20 decision rule then:
-
ACCESS UNABLE
-
Pasture or AG or Water then NON-SPLIT/NON-MOVE (record "pull azimuth and distance" to "original coordinates" from "source coordinates")
-
NON-Pasture or AG or Water then GO TO NEXT Plot.
-
ACCESS ABLE then NON-SPLIT/NON-MOVE PLOT
-
If last GPS fix is GREATER than 5 meters to the original coordinates then pull distance and azimuth to original coordinates. Data recorded at original coordinates.
-
If last GPS fix is LESS than 5 meters to the original coordinates then establish point center at this GPS fix. Data recorded at measured coordinates.
-
-
Establish plot center (flag limb above and nail flag in ground. Mark point number on both flags)
-
Pull out 36.5 meters in two cardinal (N-S or E-W) directions and flag
Record general site information (pages 1 and 2 of Field Data Sheet)
-
Site Name: Owners name, road intersections, business name, nearest town, etc.
-
Site ID#: for example: 36075F81100345
-
Coordinates (Original, UTM): the coordinates given for the original sample point in UTM
-
County: Wake, etc.
-
USGS Quad ID #: ID from lower right corner of topo map
-
USGS Quad Name: Title of topo map
-
Quarter Quad #: Quadrant of topo map
21
22
11
12
-
UTM Zone: Zone 17 (western Neuse region) or 18 eastern Neuse region
-
Site Elevation GPS: Average elevation in meters of sample site
-
Site Elevation TOPO: Average elevation in meters of sample site
-
Date: Date site sampled - MMDDYYYY
-
Time: Time site sampled - EDT
-
Crew: Last names of team
-
Differential correction method: Choose one
-
Weather: Choose major weather state at time of sampling
-
Temp: Temperature in degrees Fahrenheit at time of sampling
-
Non-Split, Split, or Moved Plot: Record data at appropriate space
-
General site description: A very general description of site characteristics, e.g. an old field plantation with sweetgum encroaching 2/3's up the crown of 65' dominant Lob overstory, Site contains a cemetery, etc. Include how site was accessed. (Also record decision rules that were applied to determine whether SPLIT, NON-SPLIT/NON-MOVE, or MOVED)
-
Plot sketch: Provide a sketch of the site documenting locations of large canopy gaps, structures, forest type changes, etc.
Record page three (3) Land Cover information
-
Impervious cover: Parking lots, buildings, roads, etc.
-
Bare surface: No crops or vegetation: Gravel lots, bare soil, etc.
-
Agriculture: Record total percent coverage of plot by agriculture.
-
Ag Types: Record in the appropriate space the Ag type percentage of the Total Agricultural area
-
Vegetation: Record total percent coverage of plot by vegetation.
-
Forest: Record in the appropriate space the percentage of the Total Vegetation area of Forest. Forest is defined as a continuous area of trees greater than 6 meters in height.
-
(Non-Forest) Trees: Record in the appropriate space the percentage of the Total Vegetation area of (Non-Forest) defined as trees not located in a forest (i.e. A row of trees separating two Ag fields or trees distributed in a suburban development)
-
Water: Record total percentage of plot covered by lakes, rivers, streams, etc.
-
Other: Anything not specifically covered above
Land Cover: Indicate percentages of each type of cover (from a satellite perspective)
-
Landform: Indicate landform from these choices:
-
Ridge top/ Upper slope: The higher ground of a region, in contrast with a valley, plain, or other low-lying, adjacent land.
-
Midslope: A point whose location is approximately mid-way between the highest and lowest elevations of a slope.
-
Midslope bench: A small level or nearly level area in a midslope
-
Lower slope: A point whose location is near the bottom of a slope
-
Flatland: Having, or marked by a continuous surface or stretch of land that is smooth, even, or horizontal, or nearly so, and that lacks any significant curvature, slope, elevations, or depressions.
-
Bottomland / Wet bottomland: The nearly level plain that borders a stream and is subject to inundation under flood-stage conditions unless protected artificially. It is usually a constructional landform built of sediment deposited during overflow and lateral migration of the streams.
-
- Slope and Aspect:
- Slope: Slope which covers the majority of the sample area
(> 50%) If slope is mixed, then detail in comment section.
- Slope: Slope which covers the majority of the sample area
(> 50%) If slope is mixed, then detail in comment section.
- Aspect: Aspect in azimuthal degrees: 0-360 degrees. Aspect need
not be documented for slopes 0-3%. For special situations:
- cove sites- if the point falls in swale of two equal in size encroaching slopes then aspect should be recorded for the swale
- hilltop - choose predominant area for aspect calculation
- Clinometer reading: Measure of dominant slope in sample area. If
slope is mixed, detail in comment section. Measure one tree to 25 meter
cutoff then visually compare surrounding dominant species to this reference.
Clinometer usage -
- For slope calculations use the percent scale (right side) and take reading downslope and upslope and average the two.
- For height calculations use the percent scale with the
following equation:
Reading / 100 * 25 meters = height of tree (meters)
* Only use the percent scale (right side of clinometer) for tree height and slope measurements
Ecological System
-
Estuarine: Consists of deep water, tidal habitats and adjacent tidal wetlands that are usually semi-enclosed by land but have open, party obstructed, or sporadic access to the open ocean, and in which the ocean water is, at least occasionally, diluted by fresh water runoff from the land.
-
Palustrine: Includes all non-tidal wetlands dominated by trees, shrubs, persistent emergents, emergent mosses or lichens, and all such wetlands that occur in tidal areas where salinity due to ocean-derived salts is below 0.5%. Also includes wetlands lacking such vegetation, but with all of the following characteristics: 1) The area is less than 20 acres; 2) Active wave-formed or bedrock shoreline features are lacking; 3) Water depth in the deepest part of the basin is less than two meters at low water; 4) Salinity due to ocean derived salts is less than 0.5%. (Also called marsh, swamp, bog).
-
Lacustrine: Includes wetlands and deep water habitats with all of the following characteristics: 1) Situated in a topographic depression or a dammed river channel; 2) Lacking trees, shrubs, persistent emergents, emergent mosses or lichens with greater than 30% areal coverage; 3) Total area is greater than 8 acres.
-
Riverine: Includes all wetlands and deep water habitats contained within a channel*, except 1) Wetlands dominated by trees, shrubs, persistent emergents, emergent mosses, or lichens; 2) Habitats with water containing ocean-derived salts greater than 0.5%.
*A channel is an open conduit either naturally or artificially created which periodically or continuously contains moving water, or which forms a connecting link between two bodies of standing water.
- Terrestrial: Includes habitats with no significant water content.
- Marine: Includes ocean or sea habitats with ocean-derived salts greater than 0.5%.
-
Successional state:
-
Primary: Establishment of plants on land not previously vegetated.
-
Secondary: Invasion of land that has been previously vegetated, the pre-existing vegetation having been destroyed by natural or human disturbance, such as windthrow, fire, logging, or cultivation.
-
Early: Cropland, grasses, weed species, pine seedlings.
-
Mid-1: Pine (shortleaf, loblolly, etc.)
-
Mid-2: Pine with hardwood understory (poplar, sweetgum, oak, etc.)
-
Late: Oak-Hickory (white oak, post oak, hickory, dogwood, loblolly pine etc.)
-
Origin: Planted or natural
-
-
Water regime:
-
Vegetated wetland: Vegetated palustrine, riverine, or lacustrine area
-
Stream: A narrow (10 ft or less) body of running water
-
River: A wide (greater than 10 ft.) body of running water
-
Lake: A body of water larger than eight acres
-
Pond: A body of water smaller than eight acres
-
Ditch: A maintained waterway for irrigation
-
Estuary: Consists of deep water, tidal habitats and adjacent tidal wetlands that are usually semi-enclosed by land but have open, party obstructed, or sporadic access to the open ocean, and in which the ocean water is, at least occasionally, diluted by fresh water runoff from the land.
-
Ocean: Deep water, tidal habitats that have unobstructed access to the open ocean
-
None: No significant water at the site
-
-
Soil moisture content:
-
Dry: Little moisture, easily friable
-
Moist: Damp to the touch, slightly muddy
-
Standing water: Water suspended above the soil surface
-
Record Data for page 5 and 6.
-
If plot is <80% vegetated, skip page 5 and 6. next
-
If major portion of plot (>80%) is vegetated:
-
Vegetation is Forest (> 6meters)
-
Record data on page 5, Densiometer and Vertical tube measurements
TRANSECT #1
-
At plot center spin pen to indicate direction of Transect #1
-
Take compass azimuth of Transect #1 direction
-
Measure 14 meters from plot center to end of transect in direction of pen
-
In section"Transect #1" at point 1 record Vertical measurements and a densiometer #1 measurement
-
Every 2 meters along Transect #1, record Vertical measurements while recording Densiometer measurements at point 7 and point 15 along transect.Thus transect #1 will be 46 meters in length with 14 Vertical measurements and three densiometer measurements.
TRANSECT #2
-
At plot center record azimuth at 90 degrees to Transect #1, then repeat the process as described under transect #1 only taking densiometer measurements at the two ends of the transect.
-
Record information under "Transect #2".
SAMPLE PLOT WITH VERTICAL TUBE AND DENSIOMETER
TRANSECTS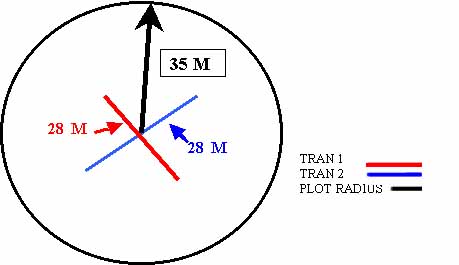
-
-
- If vegetation is not forest, skip page 5
-
-
Record data on page 6, Basal Area Measurements
-
Total Vegetative percent of entire plot > 80%, record data on page 6, upper and lower sections
- Document major species of vegetation: List major dominant/co-dominant, intermediate, and understory species. List most prevalent shrub and herbaceous species.
- Provide average height (meters), diameter at breast height (inches), and percent cover of that MAJOR area for each species out of that particular crown class( ie. Needs to add up to 100%).
- Give percent coniferous vs. deciduous for each category (dominant,
shrub, etc).
- Total Vegetative percent of entire plot < 20%, record general descriptive data in section entitled "A Description Data for Minor Area" at bottom of page 7 data sheet (ie. 20% forest and 80% water).
-
- Record additional comments regarding the site.
- Make digital pictures of the 360 degree arc around the center of the
sample plot
(azimuth readings of 0, 30, 60, 90, 120, 150, 180, 210, 240, 270, 300, 330, 360). - Take pictures of each plant species identified.