Sampling Results at the Grenada Manufacturing Facility
Overview
Air samples were collected within the manufacturing building by the Facility’s contractor during the week of October 24, 2016. EPA received the validated data on January 3, 2017, showing elevated levels of trichloroethene (TCE). Based on the results, EPA directed Ice Industries to notify workers of the elevated TCE concentrations and implement immediate actions at the Facility to reduce worker exposure.
Follow-up air sampling was performed by the Facility’s contractor in January, March and May to October 2017. Results continue to show elevated levels of TCE inside the Facility. The Facility is implementing response actions with EPA oversight to reduce TCE in all areas of the building, and is also monitoring to ensure that increased ventilation is not contributing to unsafe outdoor air levels of TCE.
Separately, EPA has directed the Facility to make improvements to the Permeable Reactive Barrier (PRB) which is used to treat the groundwater contamination.
Workplans and sampling results are posted as they become available below.
Results Summary
Facility Indoor Air and Sub-Slab Air
July through October 2017 Sampling Results
In July through October 2017, indoor air inside the Facility was sampled at six locations for a 24-hour period, 7-day and 28-day periods using both summa canisters and Radiello® samplers. This sampling effort was done to coincide with the sub-slab depressurization system (SSDS) installation and pilot test. The SSDS was installed in July and a 30-day pilot test was conducted from August 12 to September 11, 2017. During the approximate 90-day sampling period, there were a total of 55 samples collected. TCE was found to be above the Removal Management Level (RML) for sensitive populations (which includes women of childbearing age) in 13 indoor air samples collected in the manufacturing area. In one location, TCE was found to be above the RML for non-sensitive populations (which includes workers at the Facility) in one sample. RMLs are used by EPA to help determine if any future actions may be needed. A sample result higher than a RML by itself does not imply that adverse health effects will occur.
During this same sampling period, outdoor or ambient air was also sampled using Radiello®. Sample durations ranged from 24 hours to 28 days. TCE was detected in all seven samples at low levels below the indoor RML (there is no RML for outdoor air).
(See sampling report dated December 2017).
June and July 2017 Sampling Results
In June 2017, indoor air inside the Facility was sampled for a 24-hour period using both summa canisters and Radiello®. In July 2017, indoor air inside the Facility was sampled for a 7-day period using Radiello® samplers. In June, TCE was found to be above the RML for sensitive populations (which includes women of childbearing age) in five indoor air samples collected in the manufacturing area. In one location, TCE was found to be above the action level for non-sensitive populations (which includes workers at the Facility). In July, TCE was found to be above the action level for sensitive populations in one location in the manufacturing area.
(See sampling report dated June and July 2017).
May 2017 Sampling Results
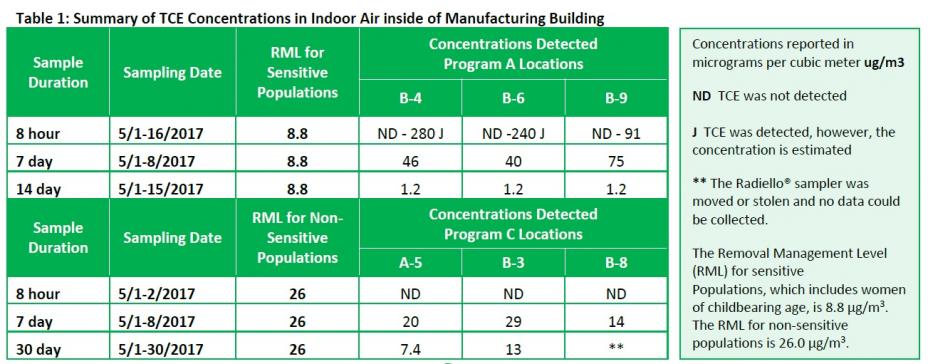
The Facility’s contractor began a new, more robust sampling protocol in May with EPA oversight. Results from May 2017 sampling ranged from non-detect to exceeding RMLs for sensitive and non-sensitive populations.
Indoor air samples were collected using Radiello® samplers that slowly draw air over a specified duration. Samples were collected at six locations, including three locations where workers among the sensitive population work (Program A– B4, B6, and B9), and three locations where workers among the non-sensitive population work (Program C – A5, B3, and B8). The six locations selected are those where employees most frequency conduct work.
Each Program A location was sampled over different time periods: eight hours (from the start of three work shifts) once a week for three weeks, over 7-days and 14-days. Each Program C location was sampled over different time periods: eight hours (from the start of three work shifts) once a week for three weeks, over 7-days and 30-days. This yielded 90 samples. The data show that interim measures continue to help lower the indoor air concentrations inside the Facility. The data is summarized in Table 1, while results by location are indicated in Figure 1.
(See sampling report dated May 2017).

Figure: May 2017 Sampling Results in Grenada
Outdoor Air Results
Outdoor air sampling performed in June (24-hour period) and July (7-day period) using Radiello® samplers did not detect TCE. Throughout May, outdoor air samples were also collected using Radiello® samplers from outside the four corners of the manufacturing building. Sample durations ranged from eight hours to 30 days. TCE was detected in two of 40 samples at low levels below the indoor RMLs (there is no RML for outdoor air).
(See sampling report dated May 2017, and June and July 2017).
Ongoing Sampling
Additional indoor air and outdoor air sampling is ongoing inside the Facility and on the Facility property.
(See workplans dated July 2017).
Future sampling results will also be made available below under “Data, Reports and Workplans.”
Previous Sampling Results (October 2016, January 2017 and March 2017)
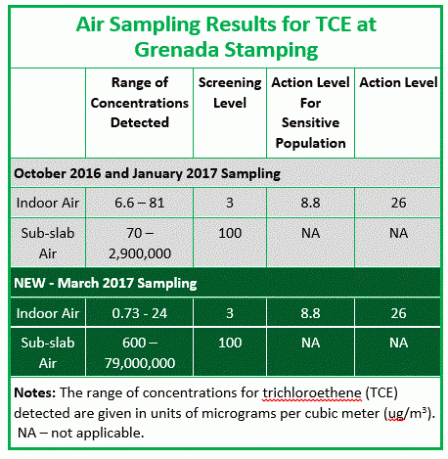
The Facility’s contractor conducted sampling with EPA oversight in October 2016, January 2017 and March 2017. Indoor air was sampled at locations in both the administrative and manufacturing areas of the Facility, and samples were also taken of the air from beneath the manufacturing building (known as “sub-slab”).
Results are summarized in the table.
 Air Sampling Results at FacilityFindings from the October 2016 and January 2017 sampling are similar. Additional locations were sampled in January in the manufacturing and office areas of the building. TCE was found to be above the screening level in all occupied indoor areas tested during both of the sampling events. In March, TCE was found to be above the screening level in 12 of 15 indoor air locations sampled in the office and production areas. TCE was found to be above the screening level in all sub-slab samples taken during each of the sampling events.
- Screening levels are values used by the EPA to help determine if a contaminant should be considered for further evaluation.
During October, TCE was found to be above the action level for sensitive populations (which includes women of childbearing age) in five indoor air samples collected in the manufacturing area. In the air near the former chrome plating line, TCE was found to be above the action level for non-sensitive populations (which includes workers at the Facility). During January, TCE was found to be above the action level for sensitive populations in the same five locations previously sampled and in two new sampling locations (one in the manufacturing area and one in the office area). TCE was found to be above the action level for non-sensitive populations in two samples collected in the manufacturing area. During March, TCE was found to be above the RML or "action level" for sensitive populations in six of the 15 indoor air samples collected in the office and production areas. TCE was not found above the action level for non-sensitive populations.
- Action levels are values used by the EPA to identify where an action may be necessary to protect public health and/or the environment.
(See sampling reports dated November 28, 2016, February 1, 2017 and March 2017).
These overall results from sampling performed to date inside the Facility indicate that TCE may be entering the Facility in the form of a gas from contaminated groundwater and soil beneath the building, a process known as “vapor intrusion.” Groundwater sampling conducted over the past three decades show that there is contaminated groundwater underneath the Facility property.
Permeable Reactive Barrier
EPA received the PRB Pilot Study Workplan in March 2016 and approved it in April 2016. Work began in May 2016 and is ongoing. Results will be posted as they become available.
Data, Reports and Workplans
- December 4, 2014 Grenada Manufacturing, LLC Facility Indoor Air Monitoring Report
- July 13, 2017 Revised Outdoor Air Monitoring Workplan for Facility
- July 13, 2017 Revised Indoor Air Sampling Workplan for Facility
- June and July 2017 Grenada Manufacturing, LLC Data Validation Reports
- May 2017 Grenada Manufacturing LLC Data Validation Reports
- April 17, 2017 - Grenada Manufacturing LLC -Revised Facility Interim Air Monitoring Plan
- March 2017 Grenada Manufacturing, LLC Data Validation Reports and Analytical Laboratory Reports for the Main Plant Building Vapor Intrusion Sampling
- March 2017 Facility Sampling Locations
- February 1, 2017 Grenada Manufacturing, LLC Data Validation Report for the Main Plant Building Vapor Intrusion Sampling
- January 2017 Facility Sampling Locations
- November 28, 2016 Grenada Manufacturing, LLC Data Validation Report for the Main Plant Building Vapor Intrusion Sampling
- October 14, 2016 Indoor Air Sampling Workplan for Facility
- March 30, 2016 Grenada Manufacturing LLC Submittal of Permeable Reactive Barrier Pilot Work Plan
