Indicators of Climate Change
Introduction
Scientists have developed hundreds of indicators to track how our environment changes over time. This slide show describes several indicators that relate to the causes and effects of climate change.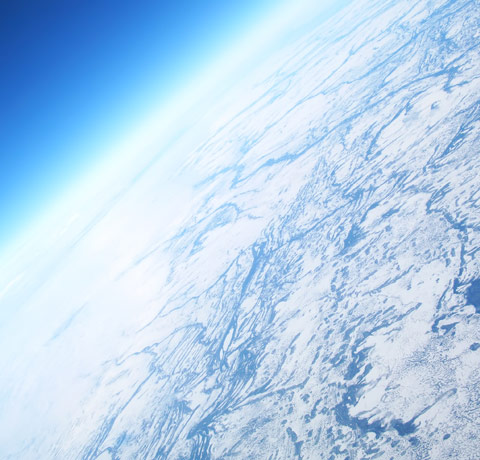
Background:
The Greenhouse Effect
The Earth receives energy from the sun, then radiates much of this energy back toward space. However, certain gases in the atmosphere, called greenhouse gases, absorb some of the outgoing energy and trap it in the atmosphere. This “greenhouse effect” occurs naturally, but human activities have substantially increased the amount of greenhouse gases in the atmosphere, causing the Earth to trap more heat. This in turn is changing the Earth's climate.
U.S. Greenhouse Gas Emissions
In the United States, greenhouse gas emissions caused by human activities increased by 14 percent from 1990 to 2008. Carbon dioxide accounts for most of the nation's emissions and most of this increase. Electricity generation is the largest source of greenhouse gas emissions in the United States, followed by transportation.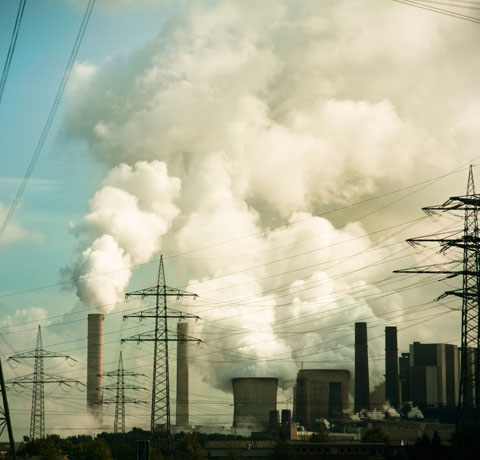
Global Greenhouse Gas Emissions
Worldwide, emissions of greenhouse gases from human activities increased by 26 percent from 1990 to 2005. Emissions of carbon dioxide, which account for nearly three-fourths of the total, increased by 31 percent over this period.
Atmospheric Concentrations of Greenhouse Gases
Concentrations of carbon dioxide and other greenhouse gases in the atmosphere have risen substantially since the beginning of the industrial era. Almost all of this increase is attributable to human activities.
Climate Forcing
Climate or “radiative” forcing is a way to measure how substances such as greenhouse gases affect the amount of energy that is absorbed by the atmosphere. An increase in radiative forcing leads to warming while a decrease in forcing produces cooling. From 1990 to 2008, the radiative forcing of all the greenhouse gases in Earth's atmosphere increased by about 26 percent.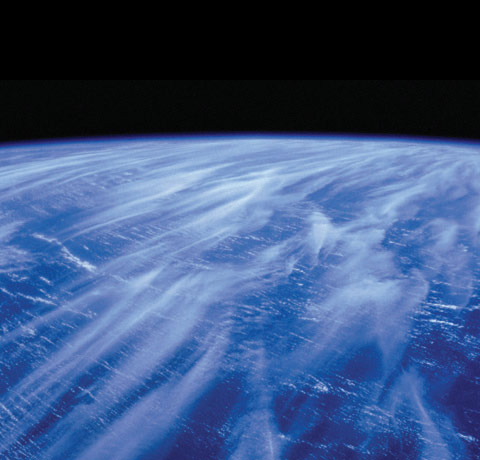
U.S. and Global Temperature
Average temperatures have risen across the lower 48 states since 1901, with an increased rate of warming over the past 30 years. Average global temperatures show a similar warming trend, and 2000–2009 was the warmest decade on record worldwide. Within the United States, parts of the North, the West, and Alaska have seen temperatures increase the most.
Heat Waves
The frequency of heat waves in the United States decreased in the 1960s and 1970s, but has risen steadily since then. The percentage of the United States experiencing heat waves has also increased. The most severe heat waves in U.S. history remain those that occurred during the “Dust Bowl” in the 1930s, although average temperatures have increased since then.
Drought
Over the period from 2001 through 2009, between 30 and 60 percent of the United States experienced drought conditions at any given time. However, the data for this indicator have not been collected for long enough to determine whether droughts are increasing or decreasing over time.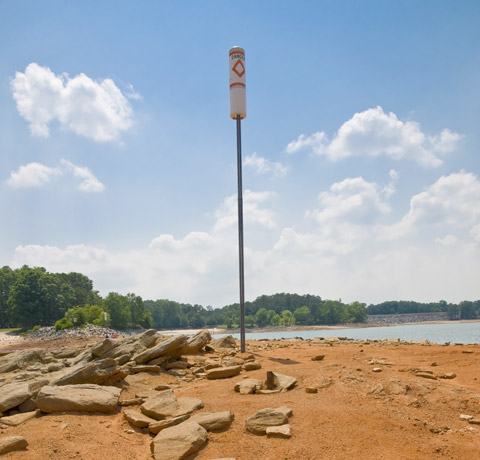
U.S. and Global Precipitation
Average precipitation has increased in the United States and worldwide. Since 1901, precipitation has increased at an average rate of more than 6 percent per century in the lower 48 states and nearly 2 percent per century worldwide.
Heavy Precipitation
In recent years, a higher percentage of precipitation in the United States has come in the form of intense single-day events. Eight of the top 10 years for extreme one-day precipitation events have occurred since 1990. The occurrence of abnormally high annual precipitation totals has also increased.
Tropical Cyclone Intensity
The intensity of tropical storms in the Atlantic Ocean, Caribbean, and Gulf of Mexico did not exhibit a strong long-term trend for much of the 20th century, but has risen noticeably over the past 20 years. Six of the 10 most active hurricane seasons have occurred since the mid-1990s. This increase is closely related to variations in sea surface temperature in the tropical Atlantic.
Ocean Heat
Several studies have shown that the amount of heat stored in the ocean has increased substantially since the 1950s. Ocean heat content not only determines sea surface temperature, but also affects sea level and currents.
Sea Surface Temperature
The surface temperature of the world's oceans increased over the 20th century. Even with some year-to-year variation, the overall increase is statistically significant, and sea surface temperatures have been higher during the past three decades than at any other time since large-scale measurement began in the late 1800s.
Sea Level
Average sea level worldwide has increased at a rate of roughly six-tenths of an inch per decade since 1870. The rate of increase has accelerated to more than an inch per decade in recent years. Changes in sea level relative to the height of the land vary widely because the land itself moves. Along the U.S. coastline, sea level has risen the most relative to the land along the Mid-Atlantic coast and parts of the Gulf Coast, while sea level has decreased relative to the land in parts of Alaska and the Northwest.
Ocean Acidity
The ocean has become more acidic over the past 20 years, and studies suggest that the ocean is substantially more acidic now than it was a few centuries ago. Rising acidity is associated with increased levels of carbon dioxide dissolved in the water, can affect sensitive organisms such as corals.
Arctic Sea Ice
Part of the Arctic Ocean stays frozen year-round. The area covered by ice is typically smallest in September, after the summer melting season. September 2007 had the least ice of any year on record, followed by 2008 and 2009. The extent of Arctic sea ice in 2009 was 24 percent below the 1979 to 2000 historical average.
Glaciers
Glaciers in the United States and around the world have generally shrunk since the 1960s, and the rate at which glaciers are melting appears to have accelerated over the last decade. Overall, glaciers worldwide have lost more than 2,000 cubic miles of water since 1960, which has contributed to the observed rise in sea level.
Lake Ice
Lakes in the northern United States generally appear to be freezing later and thawing earlier than they did in the 1800s and early 1900s. The length of time that lakes stay frozen has decreased at an average rate of one to two days per decade.
Snow Cover
The portion of North America covered by snow has generally decreased since 1972, although there has been much year-to-year variability.
Snowpack
Between 1950 and 2000, the depth of snow on the ground in early spring decreased at most measurement sites in the western United States and Canada. Spring snowpack declined by more than 75 percent in some areas, but increased in a few others.
Heat-Related Deaths
Over the past three decades, more than 6,000 deaths across the United States were caused by heat-related illness such as heat stroke. However, considerable year-to-year variability makes it difficult to determine long-term trends.
Length of Growing Season
The average length of the growing season in the lower 48 states has increased by about two weeks since the beginning of the 20th century. A particularly large and steady increase has occurred over the last 30 years. The observed changes reflect earlier spring warming as well as later arrival of fall frosts.
Plant Growing Zones
Winter low temperatures are a major factor in determining which plants can survive in a particular area. Plant growing zones have shifted noticeably northward since 1990, reflecting higher winter temperatures in most parts of the country.
Leaf and Bloom Dates
Leaf growth and flower blooms are examples of natural events whose timing can be influenced by climate change. Observations of lilacs and honeysuckles in the lower 48 states suggest that leaf growth is now occurring a few days earlier than it did in the early 1900s. Lilacs and honeysuckles are also blooming slightly earlier than in the past, but it is difficult to determine whether this change is statistically meaningful.
Bird Wintering Ranges
Some birds shift their range or alter their migration habits to adapt to changes in temperature or other environmental conditions. Long-term studies have found that bird species in North America have shifted their wintering grounds northward by an average of 35 miles since 1966, with a few species shifting by several hundred miles.