EPA On-line Tools for Site Assessment Calculation
| Module Home Objectives Table of Contents Previous < Next > |

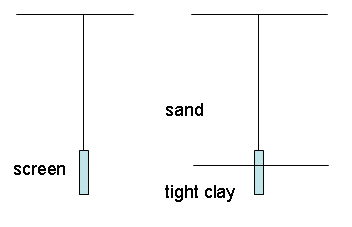
The water level in a well or head may represent a composite value of head over the entire well screen or because of heterogeneity it may better represent the head at one point or interval along the well screen. For the case illustrated above with sand overlying a tight clay, if there was an upward gradient, the head in the clay would be higher than the head in the sand. The upward gradient might be best represented by assuming that the head in the well represented a point at the bottom of the screen.
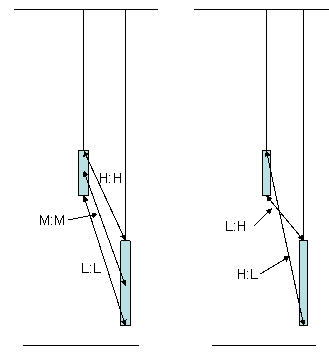
Because the detailed distribution of heterogeneities may be unknown or hidden when a vertical gradient is calculated, the calculator includes calculations for five possibilities.

These give a range of possible gradients between points on the screens:
- Mid-point to Mid-point
- High-point to High-point
- Low-point to Low-point
- High-point to Low-point
- Low-point to High-point
For screens of equal lengths, the first three choices all give the same result, no matter the relative depth of the screens. In addition they give the same value as the piezometers. If the screen lengths were zero--the wells truly functioned as piezometers and were open to only one point--all five choices give the same gradients.
Home | Glossary | Notation | Links | References | Calculators |
