EPA On-line Tools for Site Assessment Calculation
| 35 of 67 |
Alternate form of access to OnSite examples, as required by the US EPA Office of Environmental Information
Pulse Source Model Example 1 |
|||
| Purpose | How to set up the pulse source model. | ||
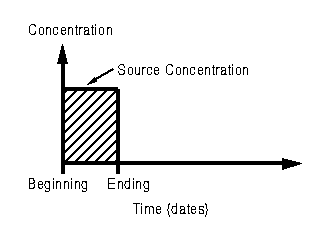
| Summary of Approach | The contaminant source releases mass into the aquifer at a constant concentration for a known duration.
The source concentration and duration are entered along with aquifer transport parameters. |
||
| Data | Distance Unit | ft | Most commonly used distance unit in U.S. |
| Time Unit | days | Times expressed in days. | |
| porosity | 0.25 | Estimated effective porosity for sandy aquifer. | |
| Fraction organic carbon | 0.0001 | Assumed low fraction of organic carbon aquifer. | |
| Hydraulic Conductivity | 10 ft/day | Assumed input value. | |
| Gradient | 0.002 | Assumed gradient. | |
| Distance (from source to receptor) | 250 ft | Assumed distance from source to receptor.
|
|
| Half Life | 730 days | Two year half life. | |
| Source Concentration | 10 mg/L | Assumed constant source concentration for the duration of the pulse. | |
| Beginning Date | October 3, 1998 | Beginning date of the pulse. | |
| Ending Date | December 13, 1999 | Ending date of the pulse. | |
| Results | Hydraulic Conductivity | 10 ft/day | Same as input as no unit conversion was requested. |
| Seepage velocity | 0.80 ft/day | Velocited associated with contaminant movement. | |
| Retardation Factor | 1.07 | Calculated retardation factor for benzene. | |
| Longitudinal Dispersivity | 13.0 ft | Estimated longitudinal dispersivity for 250 ft distance. | |
| Source Duration | 436.0 days | Difference in days between beginning and ending dates. | |
| Advective Travel Time | 3331 days | Advective travel time to receptor at 250 feet from source. | |
| Advective Travel Date | November 17, 2007 | Date associated with advective travel time. | |
| Concentration | 1.80 mg/L | Estimated concentration at selected distance (250 feet) on the advective travel date. | |
| Additional Concentrations | Time | Concentration | Additional times to better view transport of pulse. |
| 2500 | 0.18 | Decreasing concentrations with time (pulse has passed location). | |
| 3000 | 0.15 | ||
| 5500 | 0.091 | ||
Scaled Gradient Example 1 |
||
| Purpose | Example one shows how to use distances directly, without scaling from a map. | |
| Summary of Approach | Measurement Units and Map Units are both set to one foot. The distance between the wells is then entered directly using the selected "Map Unit." |
|
| Data | Wells | 200 ft apart |
| Heads | 20 ft upgradient | |
| 19 ft down gradient | ||
| Results | Gradient | - 0.005 |
Scaled Gradient Example 2 |
||
| Purpose | Example two illustrates use of the map scale with differing measurement and map units. | |
| Summary of Approach | The map has a scale of one inch to 100 feet. The distance between the wells is then entered as the number of inches between the wells. |
|
| Data | Measurement Units | 1 in |
| Map Units | 100 ft | |
| Distance Between Wells | 20 in apart | |
| Head Unit | ft | |
| Heads | 20 ft upgradient | |
| 19 ft down gradient | ||
| Results | Distance Between Wells | 2000 ft |
| Gradient | - 0.0005 | |
Scaled Gradient Example 3 |
||
| Purpose | Example two illustrates use of the map scale with differing measurement and map units. Map measurements using fractional inches. | |
| Summary of Approach | The map has a scale of one and 3/8th inches to 100 feet. The distance between the wells is then entered as the number of inches between the wells. |
|
| Data | Measurement Units | 1 3/8 in |
| Map Units | 100 ft | |
| Distance Between Wells | 20 7/8 in | |
| Head Unit | ft | |
| Heads | 20 ft upgradient | |
| 19 ft down gradient | ||
| Results | Distance Between Wells | 1520 ft |
| Gradient | - 0.00065 | |
|
Top ^
Home | Glossary | Notation | Links | References | Calculators |
