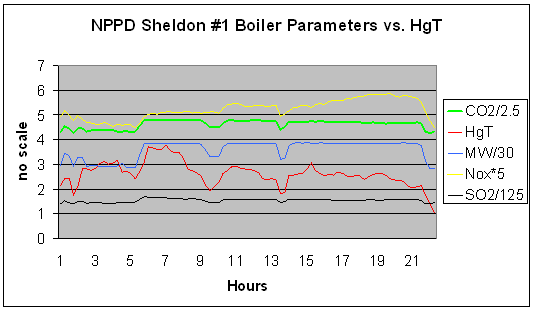

Other Plant Data Cross Check
Plot
i.e. “Sanity Check”
i.e. “Sanity Check”


| Take your Hg CEMS
Data and Plot it out. |
|
| Check it against
things like: Things are related in ways that have not yet been fully investigated.- Research will continue. |
|
| Plant Load CO/CO2
NOxSO2 We did not find a
relationship with Hg vs. Megawatts- it is more related to firing rate,
carbon-in-ash, Excess O2, etc- |
|
| COMBUSTION. |
|
| Hg changes when
other conditions change and we don’t always know why. |
|
| Though it looks like
we can track HgT by following any of the parameters shown, I feel that each
item shown is a secondary effect and not indicative of HgT. Each is actually following MW load and I
feel it is something related to MW load that HgT is following - mainly carbon
in the ash. I think we need to state
something about further analysis of data is needed because we only just
completed the RATA a week ago. |
|
| I feel kind of
strong (to myself) that a lot of the mercury variation is due to carbon
variation which is directly related to boiler fire variability. Once I track actual fire quality vs. HgT, I
think we'll know more about the fluctuations of HgT and fire quality. |
|