Demographic Population Model
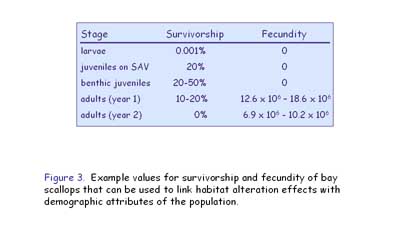
We are developing a population model to link habitat alteration effects with demographic population attributes of the scallop population. Figure 1 is an example of what a scallop population model might look like, with successive generations indicated as well as the potential for survival (P1 is the survival for larvae, P2 the survival for SAV juveniles, etc.), growth (G1 is the growth for larvae, G2 is the growth for SAV juveniles, etc.) and reproduction (f4 is the reproductive potential of a 1 year old adult, f5 is the reproductive potential of a 2 year old adult).
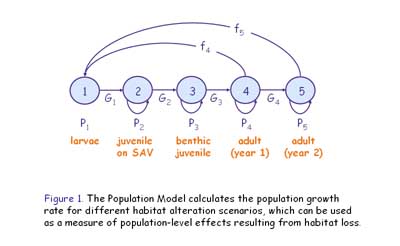
These models can include emigration and immigration from different areas, they can identify population bottlenecks, and they can help assess proposed management strategies for scallop protection and enhancement. The model can take into account numerous factors that affect bay scallop abundance, reproduction, growth, and survival (Figure 2).
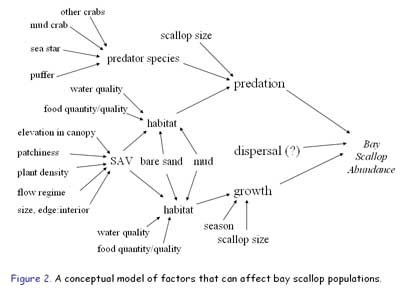
Example values for some of the population attributes of a bay scallop population are shown in Figure 3.